Monthly Archive for August, 2021

Data Analysis and Visualization with Microsoft Excel

Oil companies once ruled the globe, because they had control of an immense, untapped valuable asset – oil. It was so valuable that it was known as ‘Black Gold’. Now Data is the ‘New Oil’: the black gold of the 21st century. All businesses have lots of Data, but, in itself, Data is merely facts and figures. Just as oil needs to be refined and processed to be useful, Data needs to be analysed.

Data analysis is the process of inspecting, cleansing and transforming Data, so that it can be structured and presented as useful information, informing conclusions, and supporting decision-making. Data is, in fact, fundamentally changing the world we live in and analysing Data to find is now a key skill in many job roles.

Excel is designed specifically for Data analysis. It can connect to a wide range of Data sources, clean and transform Data automatically, and create incredible visualizations to show trends, and create reports. Infero’s new 3-day Data Analysis and Visualization with Microsoft Excel course covers all of Excel’s extensive Data analysis capabilities.
Data Analysis and Visualization with Microsoft Excel

Delivery Method – Instructor-led, group-paced, online or classroom-delivery learning model with structured hands-on activities.

Target Students – Business professionals who want to learn how to perform advanced Data and statistical analysis with Microsoft Excel using PivotTables; be able to use tools such as Power Pivot and the Data Analysis ToolPak to analyse Data, and learn how to visualize Data in charts and dashboards in Excel.

Prerequisites – Before taking this course, students are recommended to have taken the Microsoft Excel Introduction course, or have equivalent knowledge:

Course Objectives

Upon successful completion of this course, students will be able to analyse and visualize Data using Microsoft Excel and associated tools. You will:

  • Perform Data analysis fundamentals.
  • Visualize Data with Excel.
  • Analyse Data with formulas and functions.
  • Analyse Data with PivotTables.
  • Present visual insights with dashboards in Excel.
  • Create geospatial visualization with Excel.
  • Perform statistical analysis.
  • Get and transform Data.
  • Model and analyse Data with Power Pivot.
  • Present insights with reports.

Course Content


DAY 1

Lesson 1: Data Analysis Fundamentals

Topic A: Introduction to Data Science

Topic B: Create and Modify Tables

Topic C: Sort and Filter Data

Lesson 2: Visualizing Data with Excel

Topic A: Visualize Data with Charts

Topic B: Modify and Format Charts

Lesson 3: Analysing Data with Formulas and Functions

Topic A: Analyse Data with Formulas and Named Ranges

Topic B: Analyse Data with Functions

Lesson 4: Analysing Data with PivotTables

Topic A: Create a PivotTable

Topic B: Analyse PivotTable Data

Lesson 5: Presenting Visual Insights with Dashboards in Excel

Topic A: Visualize Data with PivotCharts

Topic B: Filter Data Using Slicers and Timelines

Topic C: Create a Dashboard in Excel


DAY 2

Lesson 6: Automating Data Analysis

Topic A: Implement Data Validation, Forms, and Controls

Topic B: Adding Form Controls to a Worksheet

Topic C: Create Conditional Visualizations with Lookup Functions

Lesson 7: Creating Geospatial Visualizations with Excel

Topic A: Create Map Charts in Excel

Topic B: Customize Map Charts in Excel

Lesson 8: Performing Statistical Analysis

Topic A: Visualize Trendlines and Sparklines with Excel

Topic B: Analyse Data with the Data Analysis ToolPak

Topic C: Apply Best Practices in Chart Design

DAY 3

Lesson 9: Getting and Transforming Data

Topic A: Connect to Data with Queries

Topic B: Clean and Combine Data

Topic C: Shape and Transform Data

Lesson 10: Modelling Data with Power Pivot

Topic A: Install Power Pivot in Excel

Topic B: Create Data Models with Power Pivot

Topic C: Create Power Pivots

Lesson 11: Analysing Data with Power Pivot

Topic A: Data Analysis Expressions (DAX)

Topic B: Perform Advanced Data Analysis and Visualization with DAX

Topic C: Creating a Key Performance Indicator (KPI)

Topic D: Working with Dates and Times in PowerPivot

Lesson 12: Presenting Insights with Reports

Topic A: Plan a Report

Topic B: Create a Report

4 Events for September

It’s September and autumn is almost here. The schools have gone back, and the holiday season is over. If you think that it’s now just the long wait until Christmas, you would be wrong.  There are still some great events going on across the UK. Here are four of them that you are happening during the month of September.

The 2021 Blackpool Illuminations

Everyone had heard of the Blackpool Illuminations, but you may not have seen them. They are definitely a spectacle that everyone should see at least once and have millions of visitors every year (in normal years). Known to many as the greatest free light show on earth, they have been on of Blackpool’s attraction since 1879 and have even been described as ‘Artificial Sunshine’.

Back in its full glory, after COVID-19, the annual Illuminations display is to be extended by two months this year, to provide an invaluable boost to the resort’s tourism season. The BIG Switch On event is back on Friday 3 September, with the incredible light show going on all the way through to Sunday 3 January 2022. A bigger and brighter Christmas this is also promised with themed events, shows and attractions.

DATES: Friday 3 September – Monday 3 January 2022

Take the Scilly Sea Swim Challenge

This is not for the faint hearted, but you can just be a spectator, or you can test yourself by taking the challenge of swimming and walking between all of Scilly’s main islands in just one day.

The event starts from Bar on the north side of St Mary’s, at sunrise, when those taking part dive into the sea to begin the Scilly Swim Challenge. Over the course of a single day, swimmers cross between all six of the main islands that make up the Isles of Scilly. It should be emphasised that the event is non-competitive. The point is to challenge yourself, not the others taking part. There is a total distance of approximately 15km (or just over 9 miles) of swimming to be done. Add that to the low temperatures of the September seas, and you need to be fit and prepared for this event. There is, however, another event offering the same challenge, which takes place over two days.

Dates:  The One Day Scilly Swim Challenge takes place on 10 September, while the Two-Day Challenge takes place between 7-8 September. Tickets for both are available from the website.

The Ludlow Food Festival

Add passionate local chefs and food producers, with thousands of food lovers and you get the perfect recipe for Ludlow Food Festival.

Normally held every September in the grounds of Ludlow Castle, Ludlow Food Festival claims to be the “Original Food Festival for Food and Drink Lovers” It showcases the very best local food and drink producers from Shropshire and the Marches. Inside the Castle walls, the festival includes demonstrations and talks, and it is possible to take part in workshops and masterclasses. If that sounds far too much like hard work, you can just spend time sampling the wares of the 180-plus exhibitors and stock up on tasty stuff to take home.  You’ll also find of related ‘foody’ events and activities taking place across Ludlow’s historic town centre.

Dates: 10th, 11th & 12th September 2021

Gloucester History Festival

You can Celebrate over 2,000 years of Gloucester’s history, with family activities, parades, re-enactments, talks and tours at the Gloucester History Festival. The Blackfriars Talks series features eminent historians and authors covering subjects of local and national interest.


Part of the festival includes one of the largest Heritage Open Days in the country, when the city celebrates its wealth of history, marvellous architecture and culture by offering free access to properties that are usually closed to the public.

Dates:  7-22 September

What is PowerPivot?

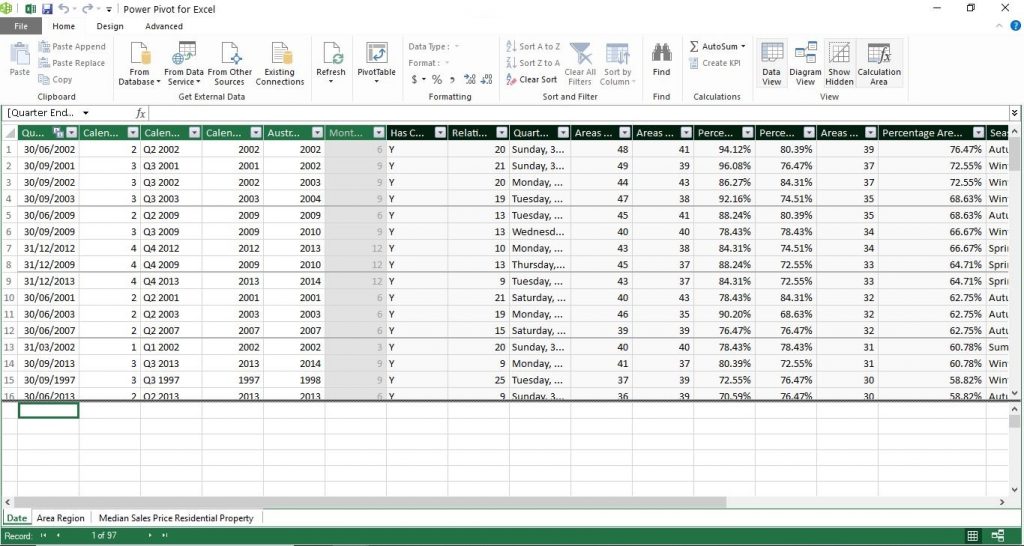
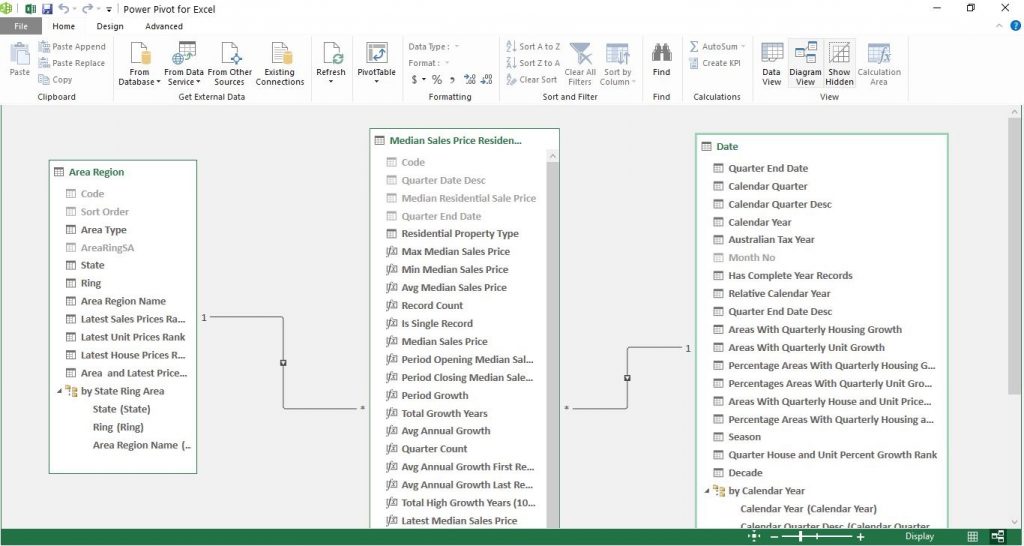
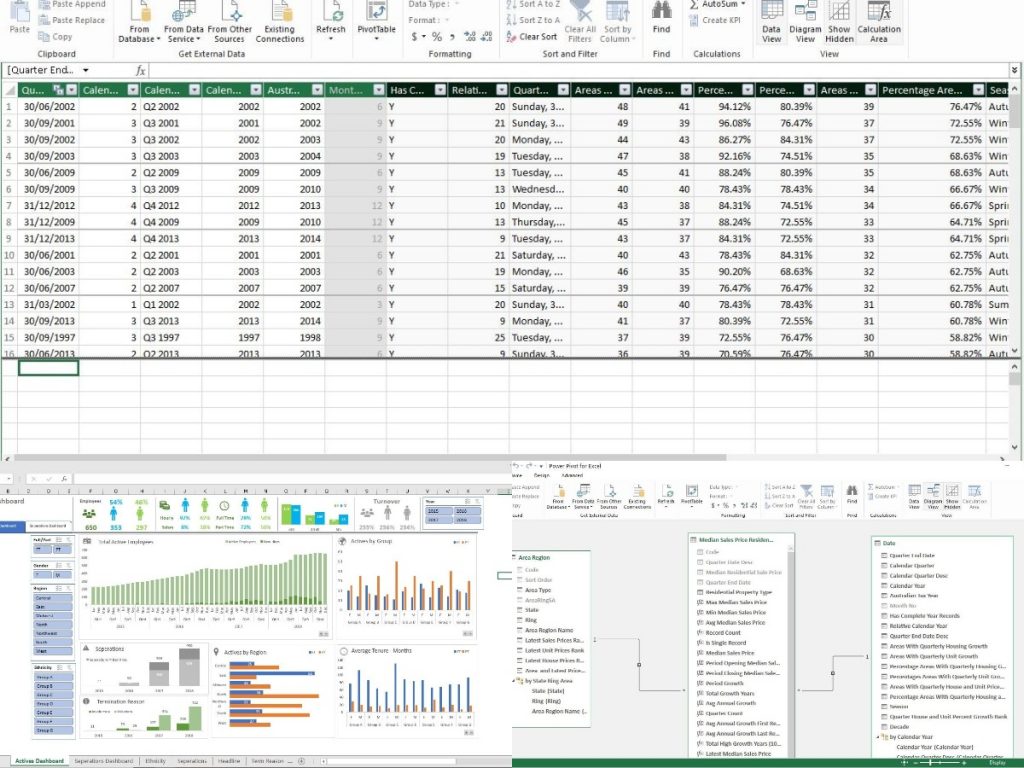
PowerPivot is an Excel add-in which allows you to take large volumes of data from various sources (all at the same time, if that’s what you need to do) and create relationships between the information in a ‘data-model’. Once there, you are able to perform information analysis and share insights. Even better PowerPivot allows you to make changes and adjustments quickly and easily.

Importing Data from Different Sources

While Excel, on its own, can manage data from a variety of sources, including SQL Server, and Microsoft Access, and even data from the web, it is difficult to create relationships between the data from such sources. However, Power Pivot was designed precisely to do this. Data from anywhere, essentially, can be imported, and relationships can be created.

Fast Data Analysis

In some cases, analysis of large sets of data, or data taken from different sources, can take several days. With Power Pivot, the same data might be analysed in hours. The real power of PowerPivot, however, is the fact that data can be easily moved, changed, and adjusted. This ability to adjust on the fly and to be able to immediately ask new questions and react to changes in a business is absolutely invaluable in the age of Big Data.

Output Data Anywhere

Power Pivot can be used to create visual data that can be outputted to Excel worksheets or to PivotTables and PivotCharts. Data on Worksheets can then be used to create a dashboard, so that the analysis that has been performed can be easily viewed and shared, and even interacted with if the worksheet is put together correctly.

It’s Still Excel But with More Capabilities. Power Pivot is still PivotTables.  It’s still formulas, but it adds many new capabilities to Excel:

  • Import and manipulate hundreds of millions of rows of data. (Excel has a limit of just over a million rows.) It has a virtually limitless data capacity
  • Import data from multiple sources into one single source workbook
  • PowerPoints manipulates and analyses data without slowing down your computer. It has fast calculations, even with multiple, massive, and linked tables.
  • Visualize the data with PivotCharts and Power BI.
  • It includes a 100+ new functions (ex: COUNTROWS, SWITCH, TOPN) which join old favourites like SUM, IF, etc.
  • All functions now work in pivots, and they auto-adjust as pivots change size & shape.
  • PowerPivot also has automatic refresh and built-in web reach.

PowerPivot is free as an add-in and available in Excel 2019, 2016, 2013, and 2010, as well as in Excel in Microsoft 365. It just needs to be enabled to take full advantage of its functionality. Microsoft has instructions on how to do this here. And you can find information on PowerPivot in different versions of Office here.

Once you have Power Pivot, it can be used to do an almost limitless number of incredibly useful tasks. PowerPivot is also part of Infero’s new Data Analysis and Visualisation with Microsoft Excel Course. Contact us to learn more about it.

What is Get & Transform (Power Query) in Excel?

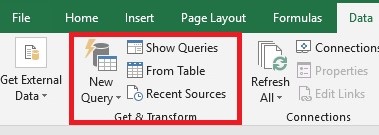
Get & Transform (formerly known as Power Query) is perhaps the biggest hidden secret in Excel and the tool that can save you hours and hours of boring and repetitive work. To analyse data in Excel, in many cases you must first import it. This can be done manually or use VBA, but manually importing data into Excel is slow, tedious and error-prone and VBA requires some programming knowledge.

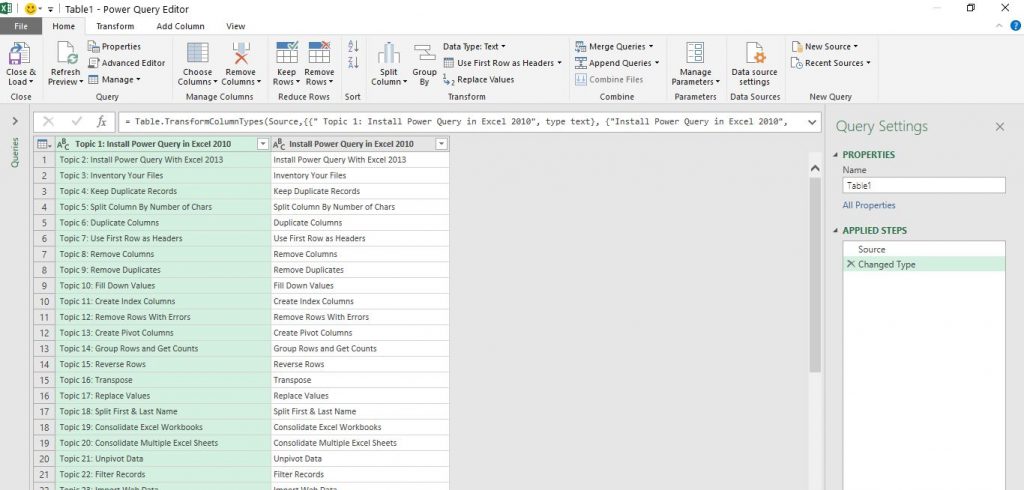
Get & Transform allows the automation of the process of importing data, but it requires no coding knowledge and tends to result in better performance. But it doesn’t only import data; Excel Get & Transform is an advanced ETL tool.  ETL is an acronym for Extract, Transform and Load.

It allows you to:

  • Extract: Most data that is analysed in Excel is imported from an external data source. Extract means moving this data from the external data source into the Get & Transform tool. This can include Excel files, Text or CSV files, Databases such as Microsoft SQL Server, Microsoft Access and Microsoft Exchange, Facebook and even web pages.
  • Transform: Extracted data often is often in a form that isn’t easily analysed. There may be unwanted columns, bad formatting or corrupted data. Get & Transform has a vast array of features that enable you to clean your data before loading to Excel table. The extracted data can be transformed in almost unlimited ways:
    • Removing columns
    • Filtering the data
    • Grouping the data,
    • Pivoting/unpivoting the data
    • Splitting up text
    • Extracting keywords from text
    • Add rows from another table
    • Remove Duplicate Records
    • Split a Column the Number of Chars
    • Duplicate Columns
    • Use First Row as Headers
    • Remove Columns
    • Remove Duplicates
    • Fill Down Values
    • Create Index Columns
    • Remove Rows With Errors
    • Group Rows and Get Counts
    • Reverse Rows
    • Transpose
    • Replace Values
    • Split First & Last Name
    • Consolidate Excel Workbooks or Worksheets
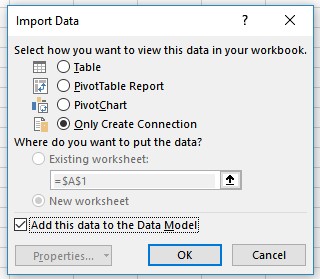
    • Load: The transformed data from the Get & Transform tool is loaded into an Excel table or into an Excel Pivot Table, where it can be analysed and shared.

    Whatever you have done, the whole transformation of the data process can then be saved as a Query. Perhaps the greatest and most time-saving feature of Get & Transform is that it allows you to set up a query once and then reuse it with a simple refresh. Get & Transform is very easy to use and pick up, more so than other Excel tools like formulas or VBA. And no coding knowledge is required. Get & Transform records all your transformations step by step. You can even go back and amend any of the steps individually.

    Get & Transform is part of Infero’s new Data Analysis and Visualisation with Microsoft Excel Course. Contact us to learn more about it. The applications for your own work in Excel could be endless.