PowerPivot is an Excel add-in which allows you to take large volumes of data from various sources (all at the same time, if that’s what you need to do) and create relationships between the information in a ‘data-model’. Once there, you are able to perform information analysis and share insights. Even better PowerPivot allows you to make changes and adjustments quickly and easily.
Importing Data from Different Sources
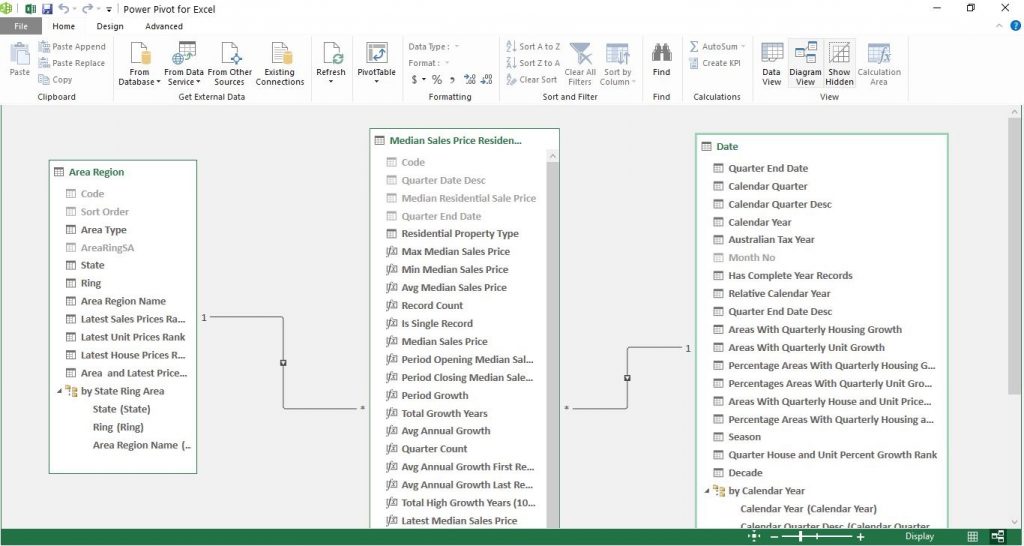
While Excel, on its own, can manage data from a variety of sources, including SQL Server, and Microsoft Access, and even data from the web, it is difficult to create relationships between the data from such sources. However, Power Pivot was designed precisely to do this. Data from anywhere, essentially, can be imported, and relationships can be created.
Fast Data Analysis
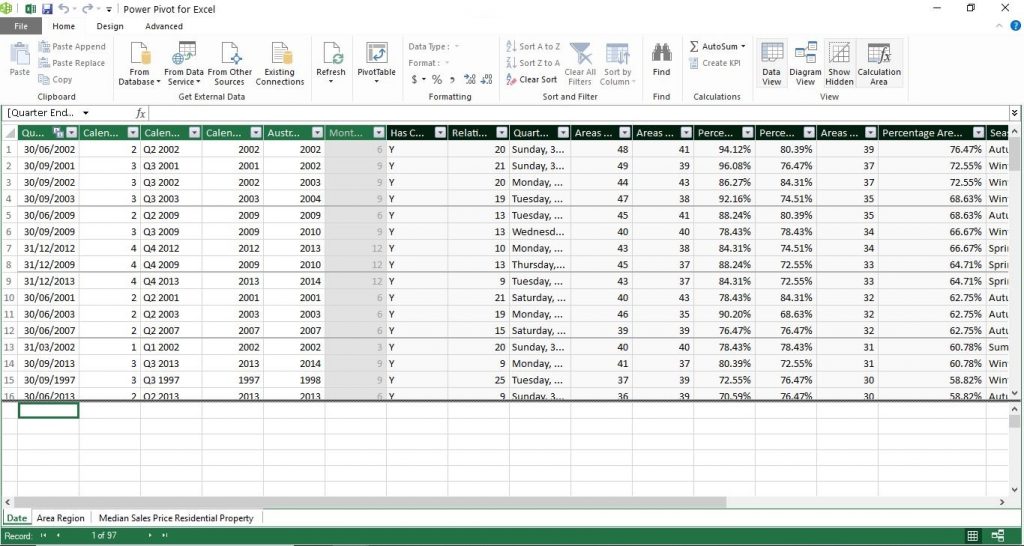
In some cases, analysis of large sets of data, or data taken from different sources, can take several days. With Power Pivot, the same data might be analysed in hours. The real power of PowerPivot, however, is the fact that data can be easily moved, changed, and adjusted. This ability to adjust on the fly and to be able to immediately ask new questions and react to changes in a business is absolutely invaluable in the age of Big Data.
Output Data Anywhere
Power Pivot can be used to create visual data that can be outputted to Excel worksheets or to PivotTables and PivotCharts. Data on Worksheets can then be used to create a dashboard, so that the analysis that has been performed can be easily viewed and shared, and even interacted with if the worksheet is put together correctly.
It’s Still Excel But with More Capabilities. Power Pivot is still PivotTables. It’s still formulas, but it adds many new capabilities to Excel:
- Import and manipulate hundreds of millions of rows of data. (Excel has a limit of just over a million rows.) It has a virtually limitless data capacity
- Import data from multiple sources into one single source workbook
- PowerPoints manipulates and analyses data without slowing down your computer. It has fast calculations, even with multiple, massive, and linked tables.
- Visualize the data with PivotCharts and Power BI.
- It includes a 100+ new functions (ex: COUNTROWS, SWITCH, TOPN) which join old favourites like SUM, IF, etc.
- All functions now work in pivots, and they auto-adjust as pivots change size & shape.
- PowerPivot also has automatic refresh and built-in web reach.
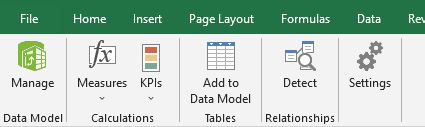
PowerPivot is free as an add-in and available in Excel 2019, 2016, 2013, and 2010, as well as in Excel in Microsoft 365. It just needs to be enabled to take full advantage of its functionality. Microsoft has instructions on how to do this here. And you can find information on PowerPivot in different versions of Office here.
Once you have Power Pivot, it can be used to do an almost limitless number of incredibly useful tasks. PowerPivot is also part of Infero’s new Data Analysis and Visualisation with Microsoft Excel Course. Contact us to learn more about it.
0 Responses to “What is PowerPivot?”
Leave a Reply