MS Visio is, basically, software for drawing diagrams; a very, very wide variety of diagrams. Along with the flowcharts, org charts, building plans and process flow diagrams that you would normally expect in a diagramming app, there are floor plans, network diagrams, mind maps, infographics, data flow diagrams, business process modelling, swim lane diagrams, 3D maps, and many more.
Visio is part of the Microsoft Office software suite, but is not included in standard editions as Excel, Word and PowerPoint are. It is sold as a stand-alone program, which is why it is much less well known. Despite this, it integrates seamlessly with all of the other Office Applications, using the same Ribbon interface and shares functionality with MS Office Word and Excel. Visio also has a large library of templates and shapes for various types of charts and there are even whole websites that have collections of Visio templates developed by third parties.
Another feature that Visio has is pulling live information from an external source. It can, for example use data dynamically from Excel and Access, making diagrams functional and current. And along with the very wide variety of built-in shapes, objects, and stencils to work with, it is possible to create your own shapes and import these for use in Visio.
How Visio is Used
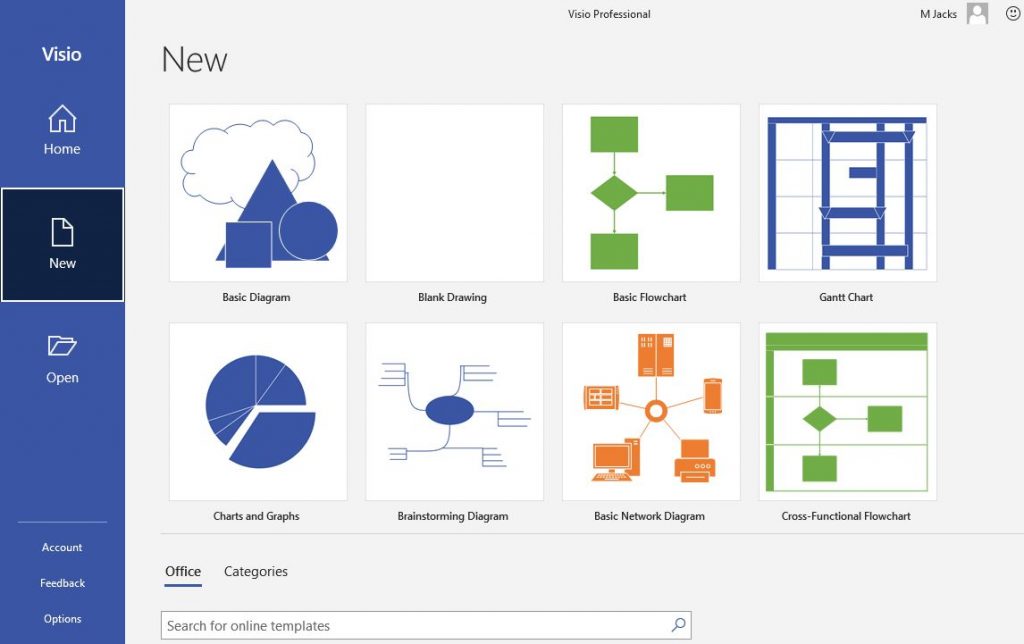
It is possible to create very professional-looking diagrams relatively easily with Visio and these can be as simple or as complicated as required. Some of the most used Diagram Types in Visio include:
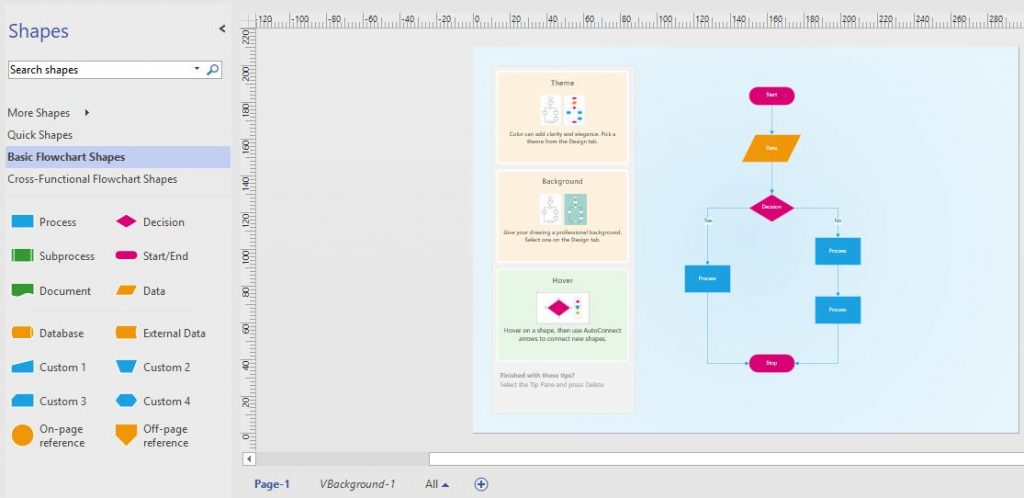
Flowcharts
Flowcharts are a visual sequence of steps and decisions for a particular process, using shapes to show the steps and arrows to show progression between steps. Flowcharts can include process flows, process maps, work flows and flow diagrams.
Organizational Charts
Organizational charts, show reporting relationships and the hierarchies within organisations. They can show the detail of who reports to who and/or the overall hierarchy of a company.
Floor Plans
Visio can create scaled diagrams like floor so that a room can be modelled using exact measurements. Tables, chairs and equipment can be moved around to find the best layout, relative to one another, within the space of a room.
Network Diagrams
A computer network diagram depicts nodes and connections in a computer network. Network diagrams use symbols to represent common network devices and diagrams can be made at the LAN (Local Area Network) or WAN (Wide Area Network) level. Visio is used extensively by IT professionals to design network diagrams.
MS Visio is so popular for creating Network Diagrams that many network equipment manufacturers supply downloadable Visio network drawings on their websites. There is an extensive collection of stencils to help aid in making network diagrams at the VisioCafe website.
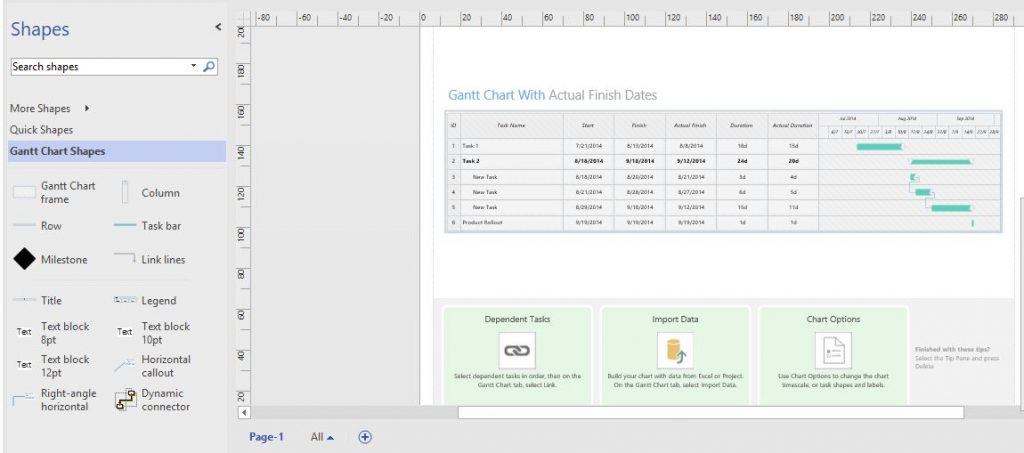
Gantt Charts
Used extensively in Project Management and the default view in MS Project, a Gantt chart shows individual tasks in a project, their start and end dates, the people assigned to the tasks and other information.
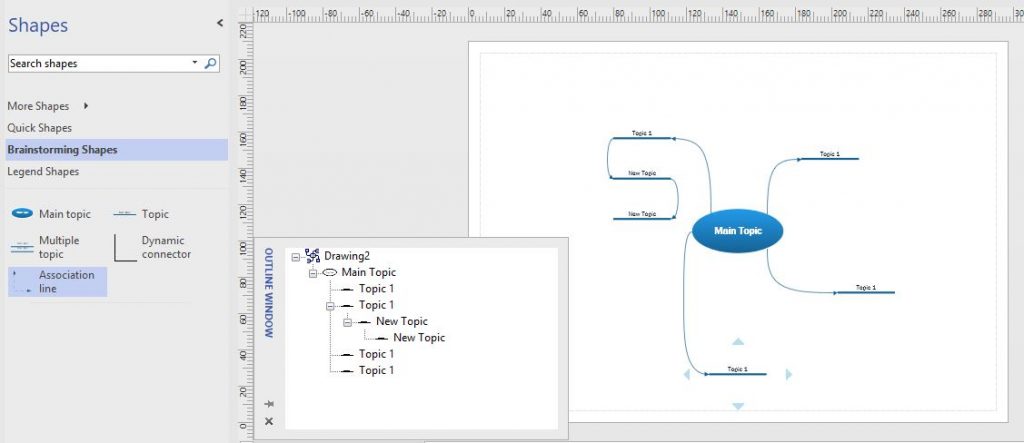
Mind Maps
Mind maps, also known as concept maps, are diagrams showing the connections between ideas. Related ideas can be grouped and connected to the overall topic. Mind maps are effective planning tools.
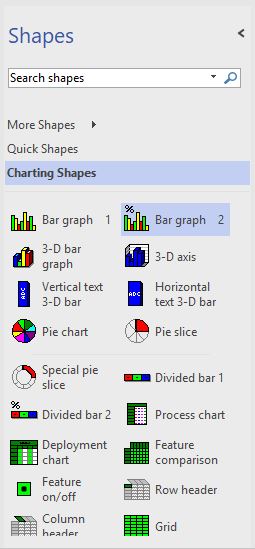
Charts & Graphs
Although more commonly used and seen in Excel, Visio also includes charts and graphs. Used to visually represent data in a way that makes the information simpler to understand. Visio can create bar charts, line charts and pie charts amongst others.
There is a lot more to Visio and Infero Training offers courses at all levels. Contact us today to find out more.
0 Responses to “What is Visio?”
Leave a Reply