Author Archive for M Jacks

Introducing Power BI and How to Get Started

Don’t let your business’s data go to waste! Power BI allows you to make data-driven decisions to achieve your company goals and propel your business forward.

Power BI

What is Power BI?

Power BI is a powerful and easy-to-use Data Visualization and Business Intelligence tool. It can take data from different, unrelated data sources and combine it into incredible interactive reports and dashboards with stunning visualisations. Moreover, the desktop version of Power BI is wholly and entirely free.

BI: (business intelligence) refers to taking raw data and transforming it to create reports that can aid in making informed business decisions. Data visualisation uses visual elements such as charts, graphs, maps, and other illustrations to analyse and find patterns and insights in data. Microsoft’s “Power BI” comprises several products and services, which include:

Microsoft Power BI Pro – A paid online service that allows users to view dashboards with a web browser and collaborate and share data. 

Power BI Mobile – A free mobile version that allows a secure connection and interaction with dashboards and reports on the go.

Microsoft Power BI Desktop – A free desktop report authoring tool that can connect to more than 70 different data sources. It’s typically known for its eye-catching visualisations, dashboards and reports. 

With Power BI Desktop, you can:

  1. Get data from a wide variety of data sources and shape the data to match your reporting needs.
  2. Create relationships between your data and change data formats
  3. Create reports choosing from dozens of visualisations with almost limitless formatting options.
  4. Save your reports as a Power BI Desktop file. 
  5. Upload or publish your reports

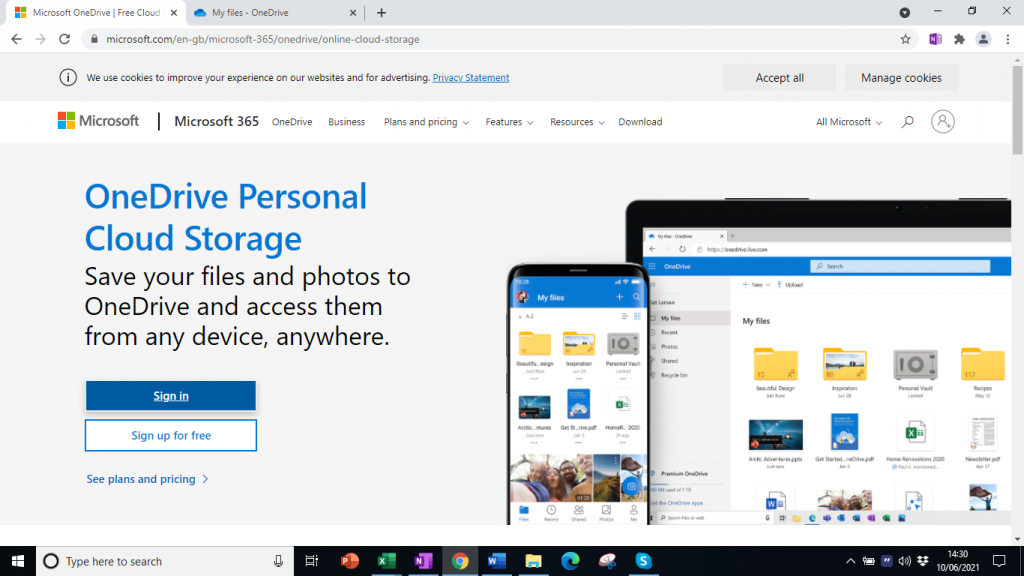
Where to download Power BI

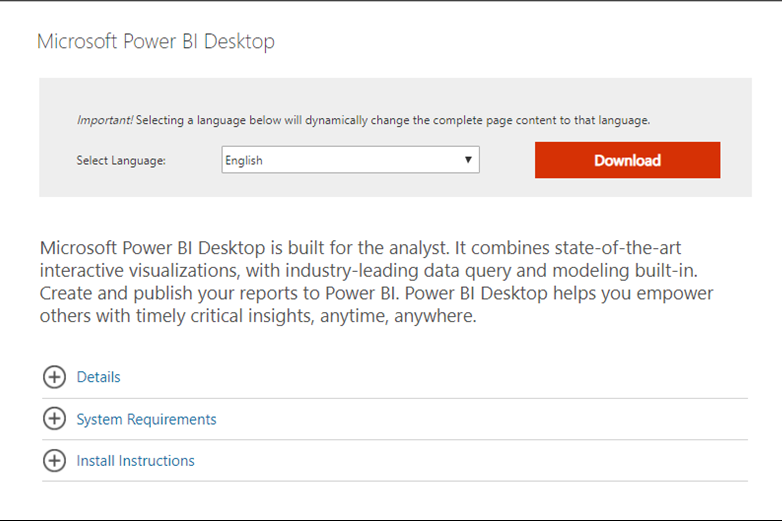
Power BI Desktop is available in both 32-bit and 64-bit versions. To download the latest version, you can use the following link.

Or you can use this link to download the Power BI files directly.

After clicking the link, you can choose the language you want to download the software. There are details on system requirements and installation instructions.

Download Microsoft Power BI Desktop

Power BI – The Main Tools
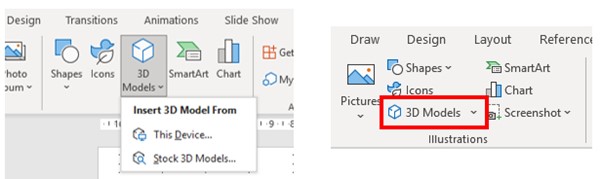
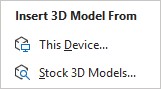
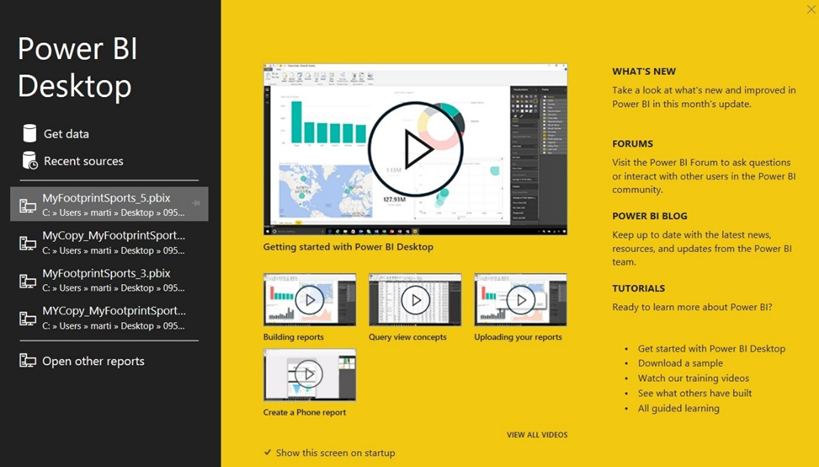
1. Welcome window

When Power BI is installed and opened, it launches a welcome screen. From here, it is possible to open data sources, see any new developments in the programme and access tutorials.

Microsoft Power BI Welcome Screen

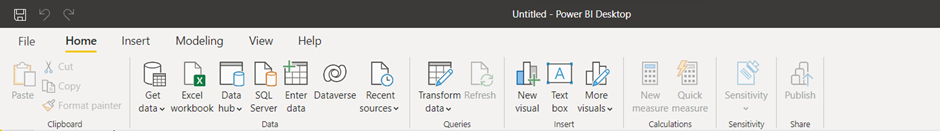
2. Power BI main interface

You will see the main Power BI Interface after closing the welcome screen. 

Microsoft Power BI Main Interface

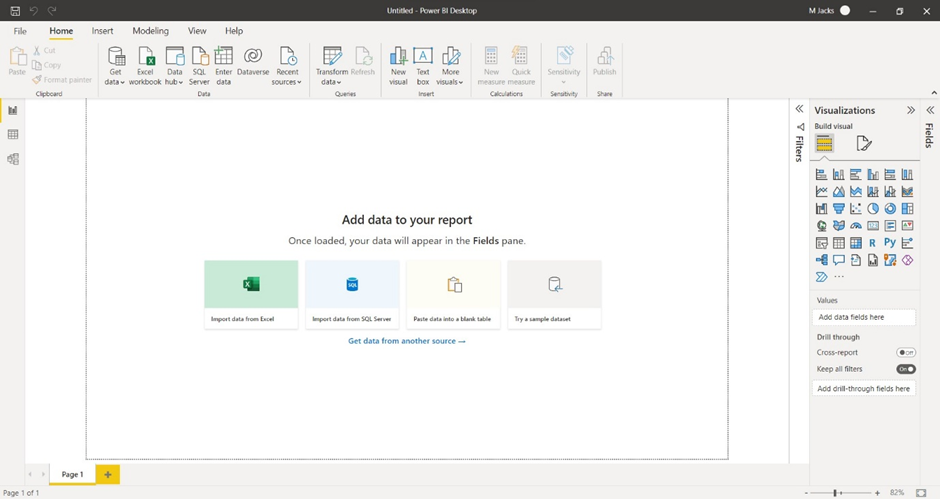
The Power BI interface, on first look, seems slightly different to other MS Office products. Still, it has many familiar elements, such as the ribbon with tabs and groups of command buttons.

Power BI Ribbon

3. Data sources

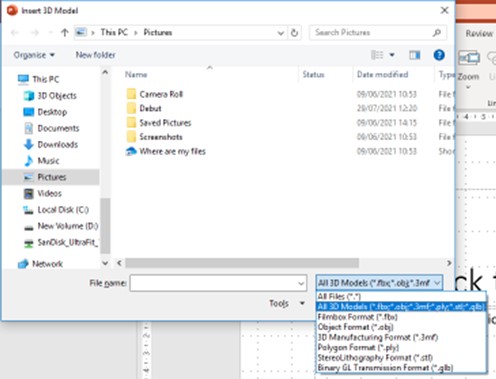
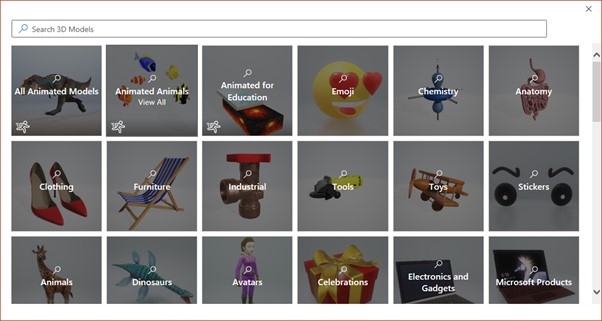
To access all of the various options regarding data sources, select the ‘Get data’ command located in the Data group of the Home tab. The command will display a list of ‘Common data sources‘.

Power BI Common Data Sources

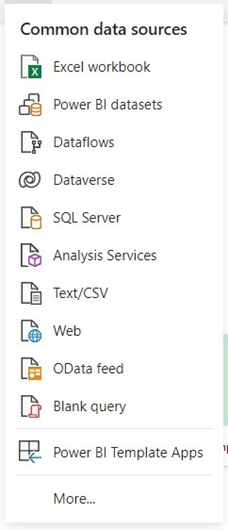
Clicking ‘More…‘ in this list will open a dialogue box that lists all the possible sources from which Power BI can access data.

Power BI Data Source List

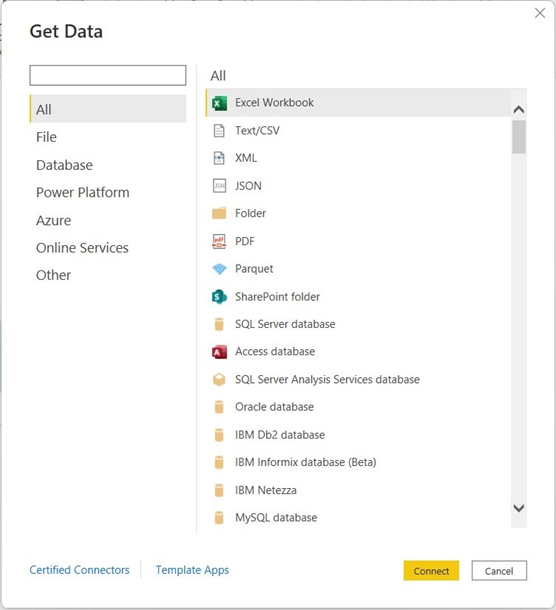
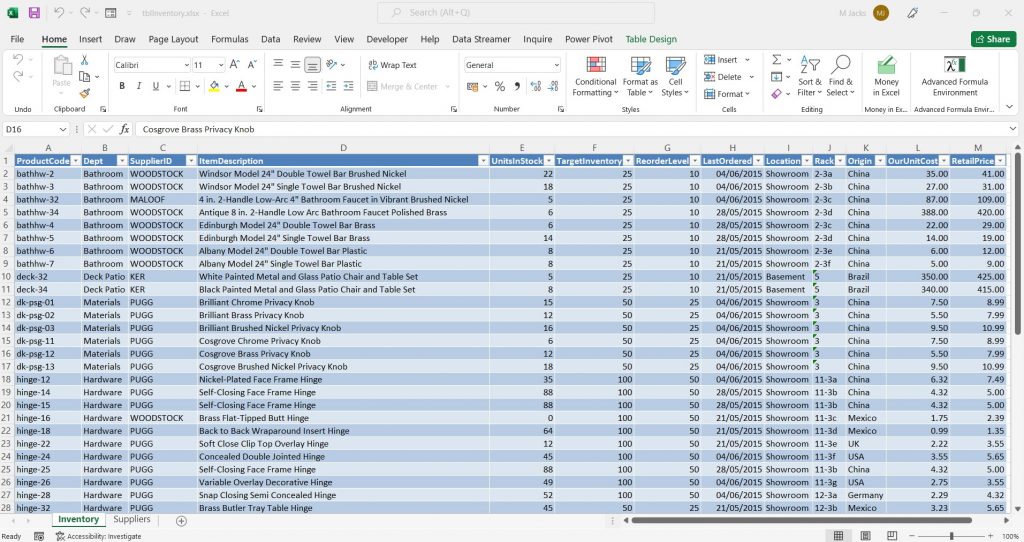
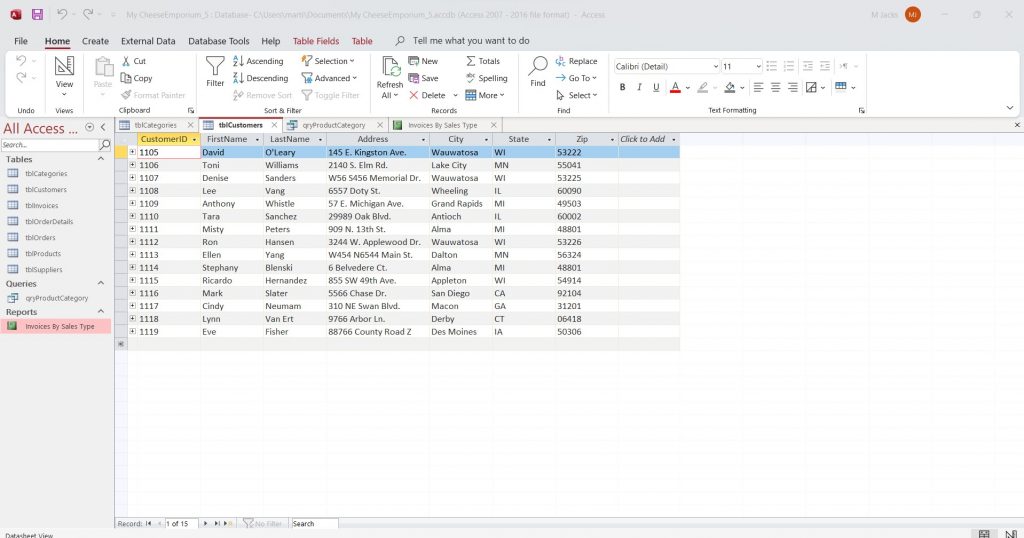
Here you can connect to different flat files such as Excel Workbooks and Text files, sources such as an SQL database, and web platforms such as Facebook, Google Analytics, and Salesforce objects.

BI is about providing the right data at the right time to the right people so that they can take the right decisions.

Nic Smith with Microsoft BI Solutions Marketing

4. Power Bi Canvas

The most used area is known as the ‘Canvas‘. You can create and configure reports, data, relationships, and dashboards here.

Power BI Canvas View

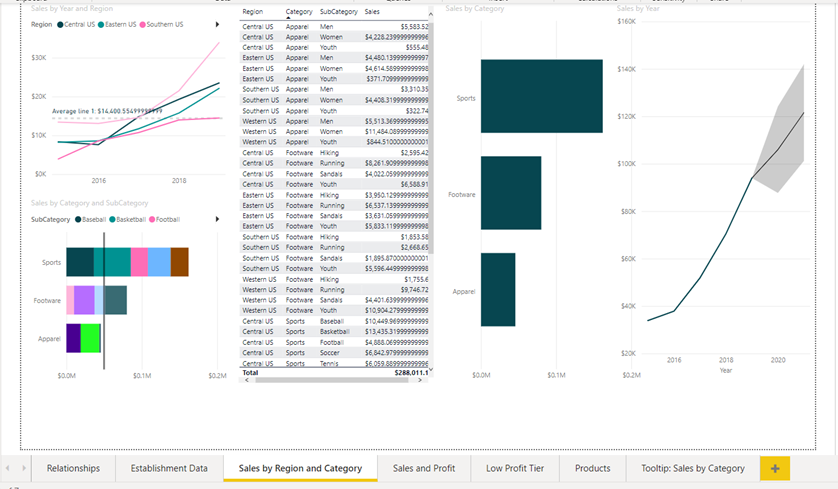
By default, Canvas displays the Report View, which shows visualisations and reports, but you can change the view by selecting the View selection icons on the left side of the Power BI interface.

View Selection Panel

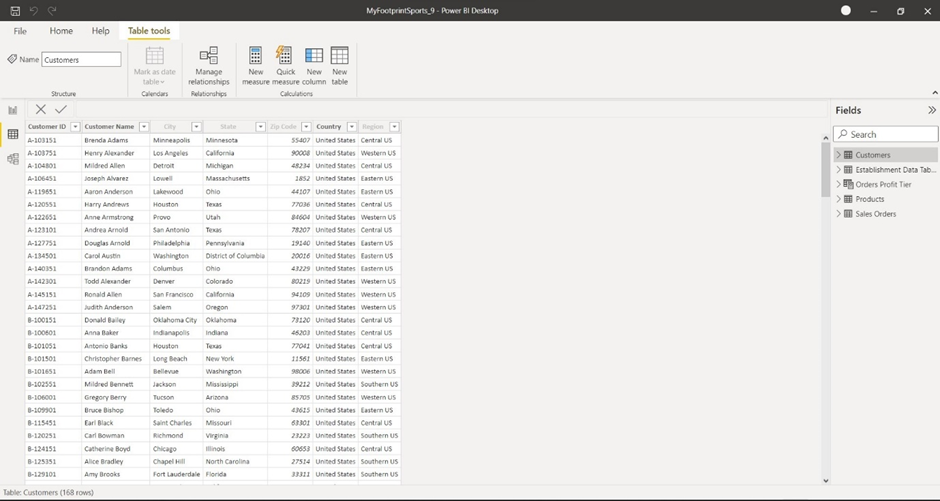
Choosing the ‘Data View‘ will display the data tables from your data sources.

Power BI Data View

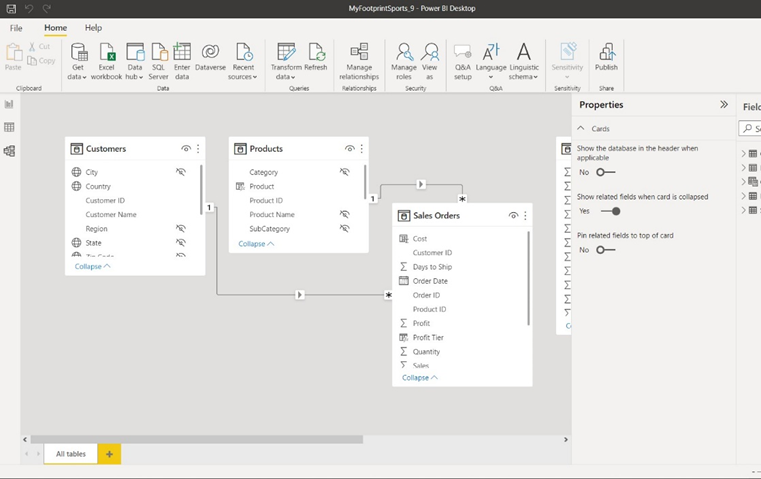
The ‘Model View‘ will show any relationships between the different tables of Data.

Power BI Model View

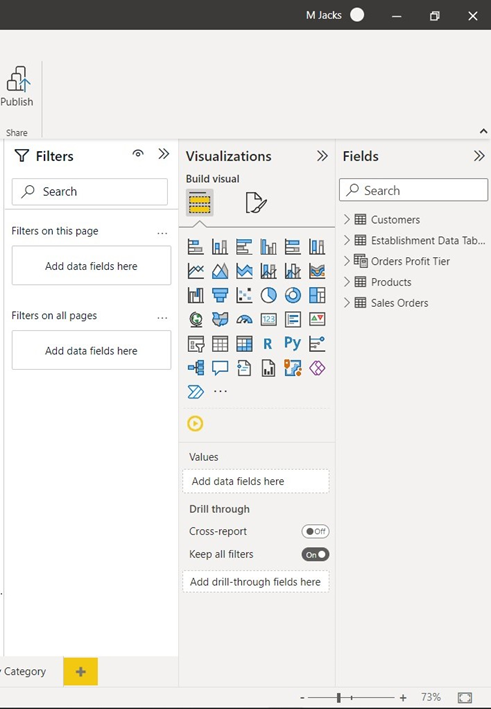
5. Configuration panes

The last main area of the Power BI interface is the ‘Configuration panes‘. There are three of these on display by default, which can change depending on what you are viewing. They are the following: 

Filters pane – Add/Configure filters to govern the data shown.

Visualisations pane – Choose visualisation type

Fields pane – Shows the field’s data source. Add data to reports by dragging fields onto the canvas.

Power BI Configuration Panes

You can collapse all panes to provide more working area on the main canvas.

If you want to learn more about Power BI, Infero Training has a Data Analysis with Power BI course that covers starting with Power BI and much more. Please get in touch to find out more.

Suite 2556
37 Westminister Buildings
Theatre Sqaure
Nottingham, NG8 2EN

Access vs Excel: How To Choose The Right One For You

Data is a major part of life, but how do we manage it? Most use Excel, some use Access. Both have their similarities. So Access vs Excel, which should we choose?

Microsoft Access vs Microsoft Excel

Contents

To jump right in, both programs can store large amounts of data, run powerful queries and perform sophisticated calculations to return the desired results.

To put things extremely simply, you use Excel for data analysis and Access for data management.

Still, if we want to know which piece of software, specifically, might be helpful for our particular needs, it’s useful to look at the benefits of both programmes.

(Note: All Microsoft Office suites include Excel, but not all suites include Access.)

1. Access vs Excel: Advantages

1.1 Advantages of Excel

Excel is a spreadsheet programme and one of the most used applications in the world, with many benefits of use:

1. Easy to Learn: Excel takes relatively little time and effort to learn. Although Excel has many advanced functions that take longer to master, you can quickly pick up the fundamentals.

2. Data Visualisation Capabilities: Excel has an incredible number of options for visualising data, including PivotTables, graphs and charts, which you can customise however you wish. 

3. Formulas and Functions: Excel formulas can do almost anything, from simple numeric calculations to very complex analyses.

4. Flexibility: Although designed for Data analysis, Excel can be (and has been) used for almost any task

(Follow this link for our beginner’s guide to Excel)

1.2 Advantages of Access:

Access is a Microsoft database management system (DBMS) used for both small and large databases.

1. Relational Database: Access allows you to relate data in one table to data in different tables. Information can be stored in one table and referenced in another.

(NB: It is also possible to have a relational database model in Excel, but this involves using Excel’s more advanced functionality.)

2. Reporting Capabilities: Access has possibly the best report-generating capabilities of any of the members of the Microsoft Office suite.

3. Storage Capacity: Access is built to handle enormous amounts of data as a database system. It can also differentiate between different types of data.

4. Data Validation: Access allows you to check or validate data in your databases as you enter it by using validation rules.

To decide if Access or Excel is best for your needs, you can consider the following questions:

5. Flat versus relational data: Is your data relational? Data contained in a single table or worksheet is called flat or nonrelational data. In a relational database, you organise your information into multiple tables.

6. Local versus external data: You can use Access to connect to data from various external data sources to view, query, and edit that data without having to import it. You can also use Excel to connect to multiple data sources (including Access), but you cannot edit the source data through the Excel user interface.

7. Data integrity versus flexibility: Access requires unique identifiers within any Table, which help preserve the integrity of your data and which are used to relate records in one table to records in another. Excel lets you enter data more freely, although it is possible to control data entry using the Data Validation command.

8. Multi-user collaboration: Access lets multiple users open a single database simultaneously because it locks only the data that another user is editing. In Excel, you can share a workbook with other users, but collaboration works best when users work on data at different times, not simultaneously.

You can also ask which data analysis tools would best suit your purpose:

9. Querying: Access allows the creation of complex queries to view your data in various ways, retrieving only the rows and columns of data you want, whether the data is contained in one or many tables.

10. Modelling? Excel has what-if analysis tools that allow you to run different scenarios on your data, such as best-case and worst-case scenarios. No similar feature is available in Access.

11. Pivoting and charting? Excel provides PivotTable reporting and advanced charting features. Although Access can produce pivoted (Crosstab) reports and has some charts available, they are not as sophisticated as those in Excel.

(Follow this link for our beginner’s guide to Access)

2. Access vs Excel: When to Use Them

2.1 When to use Excel

Excel is incredibly flexible and can store data like Access, but is optimised for data analysis and calculation. Use Excel when you:

  • Only need a flat or nonrelational view of your data.
  • Run calculations and statistical analysis.
  • Want to use PivotTable reports.
  • Create charts regularly.
  • Want options to emphasise your data, like conditional formatting icons, data bars, and colour scales.

2.2 When to use Access

Very generally, Access is the best choice when you track and record data regularly, and need to export or produce reports for subsets of that data. Use Access when you:

  • Have multiple users.
  • Will be adding more tables to a data set.
  • Want to run complex queries.
  • Want the ability to produce complex reports.

3. Using Access and Excel together

Of course, it is not necessarily an either/or choice. There may be times when it makes sense to take advantage of both programs’ benefits. It does not matter which program you have used first. There are built-in tools to bring data into Access from Excel (and vice versa) by copying, importing, or exporting it.

If you use Access to store your data and Excel to analyse it, you can benefit from both of these excellent pieces of software.

If you would like to learn more about either software, we provide certified training courses tailored to you and your requirements. Get in touch with us today for a free, no-obligation consultation.

Barker Gate
Nottingham, NG1 1JU

Microsoft Power Automate: How to Get Down With the Flow

Want to stop wasting time on tedious, repetitive tasks? Maybe it’s time to try Power Automate! Read on for our guided tour and an example to get you started.

Microsoft Power Automate does what it says on the tin. It lets you automate things. It even enables you to automate almost anything without coding, making it far easier to pick up and learn. Moreover, it’s free for all windows 10 and 11 users!

It can use your favourite applications to synchronise files, collect data, send reminders and emails or anything else that tempts your imagination. It even has pre-built automation templates for standard processes that are customisable to suit your needs better.

Power Automate was previously known as Microsoft Flow, and it comes in two types:

  1. Part of Office 365 – accessible if you have an Office subscription.
  2. Power Automate Desktop – a desktop application that integrates with Office 365 and is accessible even if you do not have a paid Office subscription.

Paid subscription or non-paid subscription, you won’t be missing out on what Microsoft Power Automate has to offer.

Taking just a little time to learn how to automate business processes using this app will save you time, speed up work and reduce costs.

Power Automate

There are two main components for Power Automate; the Console and the Flow Designer

Power Automate Console

The Console is the first thing you will see when you open Microsoft Power Automate Desktop. To start with, it will be empty, but new flows will be stored and accessed here.

There are options here to change settings and to access Help and documentation, but most important are the options to manage existing flows and add a new flow.

Power Automate Console

Power Automate Flow Designer

The flow designer will appear when you are creating a new flow or editing an existing flow.

You can think of flows as a series of actions that run sequentially in the order you supply. They can be programmed to make decisions using conditionals or loops that will repeat the same actions several times.

Power Automate Flow Designer

Flow Designer: Actions

At the top left-hand corner of the Flow Designer, you will see a bar named ‘Actions’.

This area lists all the actions that Power Automate can perform, including working with files and folders, text, emails and even specific applications such as Excel.

Power Automate Actions List

Power Automate has the actions in categories, which expand by clicking the arrow next to each category, or it’s possible to search for a specific action in the search bar at the top of the action pane.

To add an action to your flow, you can either double-click it or drag and drop it onto the main working area.

Power Automate can automate highly complex sets of actions, but it is also quick and straightforward to create these automations.

For instance, we can create a flow to open Excel, display a box with a custom message and close Excel with minimal effort, as shown in the example below.

Example: Open Excel, display a box with a custom message and close Excel

1. Download and install Power Automate

The first step is downloading and installing Power Automate, which can be found here.

If you’ve somehow managed to avoid creating a Microsoft account, you may need to sign up for one before getting started. However, this is free, and you can use a preexisting email account. For example, an Outlook.com, hotmail.com, live.com, or msn.com account should work.

2. Create a New Flow in the Power Automate Console

To create a new flow, simply click on the “+ New Flow” button at the top left of the screen.

Create new flow in the Automate Console

Power Automate will ask you to provide a name for the flow.

New flow naming window

Decide on a name for the new flow and click “Create“. In this case, we have named it “ExcelandMessage“.

3. Launch Excel Action

The next step is to locate the “Excel” actions in the Action list and expand the category.

Expanded Excel action in the Action list

Double-clicking or dragging the “Launch Excel” action to the main working area will launch the dialogue box window with options to open a new, blank Excel document or an existing one.

Launch Excel Window

We can change other options, but we will leave everything in the default setting.

4. Create Dialogue Box After Excel Launches

Next, we can expand the Message Boxes category in Actions and drag the ‘Display Message‘ action into the working area.

Again, a dialogue box is displayed that lets us enter the message box title and the message to display, along with other options.

Display Message window

In this case, we have set the Message box title to “Excel Message“, the message to display to “You just launched Excel with Power Automate“, and save this action

5. Close Excel Action

Similarly to launching Excel, we locate Excel actions and expand the category but this time, select the “Close Excel” action.

Close Excel Window

Again, we have the option of whether or not the document should be saved.

The completed flow looks like this:

Completed flow in the Flow Designer

6. Save and Run the Automation

With all this done, we can save the flow and close it to return to the Power Automate console.

Here we can see our newly created flow (it is possible to run a flow whilst still in the flow designer, at any stage, to test it).

We can run the newly created flow just by clicking on the ‘play’ button. Excel opens, and the message box is displayed.

Excel launching with Excel message displayed

On pressing the ‘OK’ button, Power Automate runs the last action and closes Excel.

In addition to all the built-in actions, Power Automate allows you to record yourself performing any task in Windows and use this as a Flow or use the recording as part of a flow using built-in actions.

Microsoft has an online Learning Path to get you started with Power Automate, and you can find it here.

A Beginners Guide to Excel: Friend or Foe

What is Excel?

It’s a good question. Excel is another multipurpose tool that has made its way into both our personal and professional lives due to its wide variety of applications and powerful functions. With over 750 million users, it is one of the most popular software applications globally.

Excel is a spreadsheet program created by Microsoft and is available as part of the Microsoft Office Package. The spreadsheet is compiled of boxes called cells, which hold data organised into columns (cells going down the way) and rows (cells going across the way), creating a sheet (hence spreadsheet). It allows us to not only store data but also display and organise this data in a clear and understandable format.

Is Excel worth learning?

As a prominent workplace tool and with many employers expecting Excel as a base skill, you will likely come face to face with Excel in your career, whether this is data entry and storage for the future, or perhaps creating a dashboard from scratch. Learning the basics will allow you to confidently approach this eventuality and avoid feeling like a deer caught in the headlights.

Additionally, it is a transferable skill applicable to many industries and even your personal life! (Anyone sheepishly reading this and thinking of the 100’s of excel sheets you have dedicated to comparing products?… You’re not alone.)

What can Excel actually do?

So now that we’ve established that excel is worth learning, what can it actually do?

  1. Make tables and databases

This might be the most apparent function and, therefore, the best place to start. Data is inserted and stored in cells where it can be visually grouped and analysed. Tables allow us to distinguish and organise data into meaningful categories. Otherwise, we have a chaotic jumble of information with no discernable relationship.

Once the data is inserted into a table, we can format the table’s design, create filters to hide or search for specific information, and rows and columns can be easily added or removed.

  1. Convert data into graphs and charts

Now that the data is arranged into tables, excel has graphical features that allow us to represent this data in graphs and charts. Graphs and charts enable us to better understand the data quickly due to their more simplistic display of the information. They are especially useful for extensive data where relationships and patterns are harder to see.

  1. Functional features

Not only can we represent data in graphs and charts, but we can also perform complex calculations with the data. This is especially useful for totalling 100+ columns and manipulating large sums of data. The alternative is the painstaking process of doing everything by hand…Excel will do this for you quickly and correctly.

And that’s why Excel is your friend!

Microsoft Excel is an incredible tool that specialises in improving efficiency and saving time. It may seem like a steep learning curve but with 750 million-plus users, we can safely assume that the benefits outweigh the trepidation of getting started. It is a lot simpler to use, and with an easy goal in mind, you’ll quickly get to know the layout and the promise of a more organised existence.

Feel like you need a bit more support getting started? Check out our comprehensive Excel Introduction Course, led by a Live Trainer who will support you at every step of the way!

5 Ways That You Can Be A Better Leader

Being a good leader is difficult. Most of us, during our working lives will have many managers and supervisors. Of these, those that we might consider really good leaders might be quite a small number. Leadership, however, like anything else, is a skill that can be learned. Becoming a good leader can have a massive impact on the success of both your own team and that of your organisation. Here are some of the ways that you can improve your supervisory skills:

Connect with your team

Leading a group of people requires a mutual sense of trust and understanding between the leader and their team members. To achieve this, leaders should learn to connect with each team member individually.

Try focusing on getting to know them as a person; their personality, interests, strengths, weaknesses and their motivations. This understanding will enable a manager to help develop team members and increase their autonomy in areas where their skills are high. This in turn will increase the employee’s engagement, motivation, investment in, and trust of, you as a leader.

Encourage professional and personal growth

It is probably already part of your Job, but acting as your team’s champion is a vital part of being an effective leader. You should be completely invested in their success and growth both professionally and personally.

This makes complete sense, because, as a leader your job is to get the very best results you can out of your team. By giving employees the opportunity to learn and develop, to upskill and move into new areas, you will increase their satisfaction, work-rate and buy-in. The old adage goes that if you, as a leader, are the smartest person in the room, then you are in the wrong room. Be the best leader and developer of people in the room. Let your team be the best at everything else.

Keep a positive attitude

As much as leaders wish their team’s day-to-day operations could run smoothly all the time, things will go wrong. Human error, unforeseen occurrences and outside forces can all, potentially, put things off track. Whether it is a minor miscommunication or a major incident, how you respond to the issue is key. Negative situations will have an effect on everyone, including you as a leader and on your team, but it is your job to remain calm and positive, even if you don’t necessarily feel that way at the time. This is exactly when your team will look to you to tell them what to do. You need to do that as effectively and positively as possible.

Give direct and honest feedback

It’s important as a leader that you give honest feedback. It is the best way to guide your team in the right direction. Again, it may be part of your job, but you need to ensure that you are constantly and regularly providing constructive feedback and performance reviews. Obviously, to give correct feedback to your team, you need to know exactly where the business is headed, it’s goals and how your own team fits into them. Part of feedback is making sure that your team also know what it is that your organisation is trying to do. The fact that they are not meeting goals might just be because they don’t understand this correctly. If you’re not direct, people won’t understand where they are not meeting set standards and won’t be able to improve

Remember to also highlight employee accomplishments. Celebrate if a team member does something great and let them know. Positive recognition has been shown to improve engagement and productivity.

Be open to new ideas

Good leaders have the emotional intelligence to understand and accept that change is inevitable and that their team may have a different way of doing things, a method which could be more effective than their own. Remember, you don’t have to be the best at anything, apart from being the best leader. Always actively encourage innovation and better work practices suggested by your team. That is what a good leader does.

Encouraging your team members to provide their insights and ideas will increase their engagement and commitment and make them work better and smarter. Remember that you are not judged by what you, personally, accomplish as a leader, but by what your team can achieve.

For a more in-depth look into how to develop your leadership skills to gain the most of your team, consider checking out our leadership courses for the best insight.

Global Employee Health and Fitness Month

May is Global Employee Health and Fitness Month, which emphasises looking after yourself, both physically and mentally. Something that will be of benefit both at work and in all other parts of our lives.

History

We all know that maintaining our health and fitness will improve the overall quality of our lives, but as we grow older, we can get stuck in our routines and habits, whether they are good or bad, and it’s easy to neglect our mental and physical well-being. This is one of the reasons that the Global Employee and Fitness Month was launched in 1989, to provide an opportunity for workers to reflect on their lives and inspire employers to come up with new, innovative ideas to motivate employees around the world to improve their health and fitness.

As the Global Employee Health & Fitness Month (GEHFM) says on it’s website:

“Global Employee Health & Fitness Month is an international observance of health and fitness in the workplace. The goal of GEHFM is to promote the benefits of a healthy lifestyle to employers and their employees through worksite health promotion activities and environments.”

The role of employers is emphasised, as they are the ones who create the initiatives, to not only spread awareness of how essential good health is, but to also urge their employees to participate in projects and activities that have real physical and mental health benefits. It is not just employers who get involved in the month, however. Universities, local governments, hospitals, and health departments also play a great role in the successful celebration of this month.

How to Observe

Arrange a yoga session at your workplace: There are many forms of exercise that can help both physically and mentally. Yoga is one of the oldest and most proven. Perhaps arrange a yoga session in your work place, or,  if you work from home,  set aside half an hour for some yoga yourself. It can definitely help your body, but might also bring some peace to your hectic day.

Host an event with a variety of physical activities: If yoga isn’t your thing, persuade your employer to host an event with trials of many activities, such as swimming, running or weight lifting. The broader the options the better and the more people who are likely to get involved.

Bike to Work Scheme: Many companies have a bike to work scheme, which can benefit both employees and employers when the latter choose to cycle rather than drive to work. Whilst the health benefits to employees may be self-evident, Employers who have started such a scheme have reported less sick days amongst those who cycle, a lower carbon footprint; with the added financial incentive that  employers can save up to 13.1% in NI contributions.

Find out more about the bike to work scheme.

The Benefits of the Month

A Healthy mind is a productive mind: Living a healthier lifestyle, through a balanced diet and exercise will almost certainly mean an improvement in mental wellbeing, which can itself lead to a more productive lifestyle. Regular exercise can release dopamine, a chemical than makes us feel happier and satisfied, an important factor in regards to how hard we work.

Improving your health can make you less stressed: Sustained exercise will increase blood flow and pumps up endorphin production, the body’s natural painkillers, directly linked to reducing your stress. Being stressed can lead to de-motivation and burn-out, so adding a short exercise to your daily routine could really make a difference in both your work and home life.

Becoming energetic and motivated: Since exercise and healthy food provide energy, you are much more likely to be motivated to take on new projects and follow them through. If you need help with time management to help fit in extra time for your fitness and well-being, check out our Time Management courses.

Easy 3D Models in PowerPoint, Word and Excel

It may have escaped your attention, but it is now possible to insert 3D models into Office documents. The feature is available to Office 365 subscribers and to anyone who has the 2019 or 2021 Desktop versions of MS Office and it allows the easy insertion of 3D models into any PowerPoint, Word, or Excel file.

Key Features of 3D Models

  • 3D objects can be moved and resized in the same way as images, but can also be rotated along 3 different axes using a very simple control.
  • 3D models can be animated within PowerPoint using aminations like Turntable, Swing and Jump & Turn
  • If the same 3D object is used on consecutive slides in PowerPoint and combined with a Morph transition, the object is animated in 3D.

It is very easy to get a 3D model into your Word Document, PowerPoint Presentation or Excel Workbook. On the Ribbon at the top of any of the applications, simply click on the Insert tab and look for the Illustrations group, which is on the left-hand side of the Tab.

Although the Illustrations group is configured slightly differently, in Word, Excel and PowerPoint, this is always where you will find the 3D Model command.

Once the 3D object is inserted, manipulate the built-in tools to allow you to easily rotate, flip, spin, pan, and zoom for ideal placement.

3D Models in PowerPoint

Since you are most likely to use 3D Models in PowerPoint, we will concentrate on that, but inserting and manipulating 3D models in any of the other Office programmes will work in exactly the same way. Just follow the same steps that you would use to insert photos or videos in PowerPoint. Go to Insert → Select 3D Models and from the drop-down menu, choose how you want to insert a 3D file.

If you already have a 3D model that you have created or downloaded, then you can use the This Device option. A number of different 3D file formats can be inserted into PowerPoint slide. Just select the format that your 3D model is in.

Select the format that your 3D model is in.

If you don’t have an existing 3D Model, then you can opt for the Stock 3D Models command, where there are many options of pre-existing models. You can even search for exactly what you want.

Once the 3D model is inserted, rotate the model to the angle that you wish it to appear on the slide. This is done by clicking on the 3D model itself, which will cause a 3D rotation control to appear at the object’s centre, which can then be used to rotate the object as you wish. You can still use the normal rotation handle at the top of the object to rotate your image clockwise or counter-clockwise, but you’ll get a much better experience using the 3D rotation control.

3D Model in Various Views

Any 3D object can be moved, resized and aligned just like a normal picture, shape, icon or any object that is normally inserted into a PowerPoint slide. It isn’t yet possible to edit the 3D models themselves within PowerPoint, but if you have Paint 3D, it can be done with this programme.

When a 3D model is selected a 3D Model contextual tab appears on the Ribbon.

This includes options to reset the model, switch it to set views and arrange it relative to other objects on the slide. There are also controls for sizing the object including Pan and Zoom.

3D objects are very easily inserted into Slides and have multiple uses.

Six Ways That You Can Improve Your Communication Skills

Improving your communication skills is advantageous to you and everyone around you. Good communicators are seen as confident and trustworthy and these skills can help in both your professional and personal life.

Here are 6 ways that you can improve your communication skills:

Listening Effectively:

This is one of the most important, yet overlooked, aspects of communication. It is natural to try to think of a response to the other person while they are still talking, but taking time to let them finish and trying to fully understand what they are saying can pay dividends. If you are unsure about something that has been said, ask for clarification, or for the person to repeat their point again.

And when listening, stick to one communication at a time. It’s always tempting when speaking to someone on the phone, to, perhaps, respond to an email at the same time. But it is very likely that you will miss something the other person is saying. Trying to do both things at once may mean that you end up doing neither of them particularly well.

Body language:

This is something that we all are aware of, but which, surprisingly, most of us still don’t think about when we are communicating. A few simple things in this area can make a great deal of difference in our communication with others. Don’t cross your arms, keep eye contact, sit up straight so you look professional and be as open as possible. We don’t have to be body language experts to use it effectively in communication.

Be Concise

In written and verbal communication, try to be as brief and concise as possible, whilst still conveying all the information required. Try not to ramble or go into areas of information that are just not needed.

Maintain a positive attitude and smile:

This one is simple. Smile and be positive. Smile even when speaking on the phone, because the other person will know it. Smile often and exude a positive attitude and people will respond positively to you.

Empathy:

Being able to understand the feelings of those around you is an integral part of being an effective communicator. Empathising means both understanding and relating to someone else’s feelings. Having high emotional intelligence and demonstrating an ability to empathise builds rapport between you and others and increases your ability to communicate.

Practice public speaking:

Public speaking may sound daunting, but there’s no better way to develop good communication skills. Good communicators are able to clearly articulate their feelings, whether speaking to a large group or talking face-to-face with one other person. Speaking in front of a group will highlight your strengths, as well as letting you know those areas that you need to improve on.

Our course in Advanced Communication Skills will show you how to apply advanced verbal and written communication techniques in your workplace.

XLOOKUP – The New Improved VLOOKUP

In Microsoft Excel, everyone has heard of the VLOOKUP function. It is one of the most used functions within Excel and the function that most people want to learn. This is not surprising, because VLOOKUP is extremely useful and can be used in a wide variety of situations. It is capable of very complex data analysis, but can also be used very simply. In essence VLOOKUP does what it says on the tin. It looks things up. So why have Microsoft, effectively, created a replacement for it?

Although VLOOKUP is used by millions of Excel users every day, it is not without faults. In fact, many Excel users use alternative formulas because of this. VLOOKUP has three main issues:

Only Left to Right

VLOOKUP only works from left to right. That is, it can only find a result value in a column to the left of the value that is being used as the look-up value. In the example below, if the Employee IDs were in a column right of the AGEs, it wouldn’t work.

The Column Number Issue

The column with the result required is designated by an index number. This means that if we want VLOOKUP to return data from the 2nd column of our data, we need to type in 2. The problem comes if another column is inserted into our data. Although our VLOOKUP will still have an index number of 2, the value we want to return may not be in the 2nd column anymore. At best, we won’t get the result we expect, at worst the VLOOKUP may stop working altogether.

VLOOKUP Defaults to an Approximate Match

LOOKUP functions in Excel can return an Exact match, meaning that they will only give a result if they can find precisely what we are looking for, or they can return an approximate match, meaning they will return the result nearest to the value we were searching for. Even though 99.9 % of the searches done with VLOOKUP are for an exact match, VLOOKUP default to an approximate match.

XLOOKUP fixes all these issues and more:

Left Lookup

VLOOKUP will not allow a left lookup to be performed. Before XLOOKUP, this could be done by using a combination of INDEX and MATCH functions, but this was quite complicated. Now a left lookup can be completed simply by using the XLOOKUP function.

The XLOOKUP function looks up the age and returns the Employee ID.

Column Number

XLOOKUP allows the returning of a value from a particular column simply by selecting it or typing its range within the formula. A column number need not be specified and so the formula can’t be broken if columns or rows are inserted or deleted.

Exact Match

By default, the XLOOKUP function in Excel 365/2021 performs an exact match, unlike VLOOKUP.

XLOOKUP is only available in Office 2021 and Office 365. VLOOKUP will remain available in Excel, but there are many more benefits in using XLOOKUP, such as being able to return values from above and below, as well as from left and right. To find out more and to learn how to use this new function fully, why not try one of our Excel courses.

Setting Up and Using OneDrive

OneDrive is the cloud storage service from Microsoft which will both store your files securely and allow you to access them from almost any device. It is one of many online storage services, such as Dropbox, Google Drive, and iCloud, but only Microsoft OneDrive is built directly into Windows 10.

Like all Cloud storage services, OneDrive acts as if it is an external drive, but because it is available through the internet folders and files can be backed up and synced in the cloud. OneDrive works across different devices and platforms. It is entirely possible to create a file on one device and continue working on it on another (PC, laptop, tablet, or phone).

Files on OneDrive can be easily shared with other people, and if you have Microsoft 365 you can collaborate with someone else, on a file, in real-time.

You don’t even need to use Windows to be able to use OneDrive, but if you have a Windows 10 device, there are even more features available, including a ‘Personal Vault’ where important and sensitive files are protected with an extra level of security.

Whatever device you are using, whether it is a Windows 10 Laptop, an Android phone, or anything else, to sign up for and use OneDrive, you will need a Microsoft Account. This is easy to set up and you can sign up for one here. The good news is that if you already have a @outlook.com, @live.com, or @hotmail.com email address, or Xbox network account, you already have a Microsoft account and can use any of these.

Storage

A basic free plan for OneDrive provides 5GB of OneDrive space. You can get 100GB of storage by paying a small monthly fee, but if you already have a subscription to Microsoft 365, then you may already have a whole 1TB of OneDrive space available.

Creating a OneDrive Account

Firstly, go to the OneDrive website here. You will need to click the ‘Sign In’ button.

You will get an option to either enter the email of an existing OneDrive account or to Create a New Account.

Click the ‘Create one!’ option.

If you do already have a @outlook.com, @live.com, or @hotmail.com email address, or Xbox network account, you can enter this to create your account, otherwise, click ‘Get a new email address’.

You can choose whether to have an @outlook or @hotmail address and then just follow the on-screen instructions to complete the signing-up process.

Once the OneDrive account is created, on Windows 10, OneDrive is usually automatically configured. In most cases, in Windows, the one Drive Client software will already be on your device, but if not download the OneDrive client offline installer from Microsoft and double-click the file to install it.

If you are installing on another device, like an Apple or Android phone, you will need to get the OneDrive App from the appropriate App store.

Once you have the software or app on your device, you just need to sign in. In Windows,  click the cloud icon from the notification area.

Then select the Sign in button.

Follow the directions to confirm your Microsoft account address and password. Click the Sign in button again.

You should be good to go.

View and Manage Folders and Files

In OneDrive, you can change settings for managing, syncing and sharing files. OneDrive will appear in File Explorer, like any other drive on your computer, and you can view and manage files there.

If you want to view your files online, just right-click any of the folders or files in OneDrive and choose ‘View online’ from the menu.

You can change a wide variety of options in OneDrive. Click on the cloud Icon in the Notification Area. Click on ‘Help & Settings’ and you will be presented with a dialog box where you can change whether OneDrive starts automatically with Windows, control Notifications, add other accounts and many other options.

Share Files 

Sharing files with others, whether they have OneDrive or not, is easy. You can share whole folders or individul files and this can be done from both File Explorer or from your OneDrive site. Just right-click the file or folder you wish to share and click ‘Share’ from the menu.

Before the link is sent, you can control how whether the person being sent the link will have editing rights, when the link will expire and if a password is  required.

There is much, much more to OneDrive. If you want to learn more, contact us here at Infero.