Don’t let your business’s data go to waste! Power BI allows you to make data-driven decisions to achieve your company goals and propel your business forward.

What is Power BI?
Power BI is a powerful and easy-to-use Data Visualization and Business Intelligence tool. It can take data from different, unrelated data sources and combine it into incredible interactive reports and dashboards with stunning visualisations. Moreover, the desktop version of Power BI is wholly and entirely free.
BI: (business intelligence) refers to taking raw data and transforming it to create reports that can aid in making informed business decisions. Data visualisation uses visual elements such as charts, graphs, maps, and other illustrations to analyse and find patterns and insights in data. Microsoft’s “Power BI” comprises several products and services, which include:
Microsoft Power BI Pro – A paid online service that allows users to view dashboards with a web browser and collaborate and share data.
Power BI Mobile – A free mobile version that allows a secure connection and interaction with dashboards and reports on the go.
Microsoft Power BI Desktop – A free desktop report authoring tool that can connect to more than 70 different data sources. It’s typically known for its eye-catching visualisations, dashboards and reports.
With Power BI Desktop, you can:
- Get data from a wide variety of data sources and shape the data to match your reporting needs.
- Create relationships between your data and change data formats
- Create reports choosing from dozens of visualisations with almost limitless formatting options.
- Save your reports as a Power BI Desktop file.
- Upload or publish your reports
Where to download Power BI
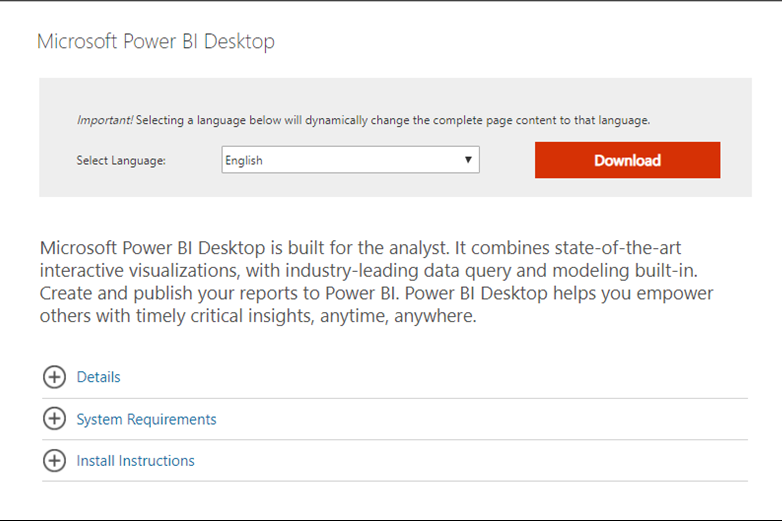
Power BI Desktop is available in both 32-bit and 64-bit versions. To download the latest version, you can use the following link.
Or you can use this link to download the Power BI files directly.
After clicking the link, you can choose the language you want to download the software. There are details on system requirements and installation instructions.

Power BI – The Main Tools
1. Welcome window
When Power BI is installed and opened, it launches a welcome screen. From here, it is possible to open data sources, see any new developments in the programme and access tutorials.

2. Power BI main interface
You will see the main Power BI Interface after closing the welcome screen.

The Power BI interface, on first look, seems slightly different to other MS Office products. Still, it has many familiar elements, such as the ribbon with tabs and groups of command buttons.

3. Data sources
To access all of the various options regarding data sources, select the ‘Get data’ command located in the Data group of the Home tab. The command will display a list of ‘Common data sources‘.

Clicking ‘More…‘ in this list will open a dialogue box that lists all the possible sources from which Power BI can access data.

Here you can connect to different flat files such as Excel Workbooks and Text files, sources such as an SQL database, and web platforms such as Facebook, Google Analytics, and Salesforce objects.
BI is about providing the right data at the right time to the right people so that they can take the right decisions.
Nic Smith with Microsoft BI Solutions Marketing
4. Power Bi Canvas
The most used area is known as the ‘Canvas‘. You can create and configure reports, data, relationships, and dashboards here.

By default, Canvas displays the Report View, which shows visualisations and reports, but you can change the view by selecting the View selection icons on the left side of the Power BI interface.

Choosing the ‘Data View‘ will display the data tables from your data sources.

The ‘Model View‘ will show any relationships between the different tables of Data.

5. Configuration panes
The last main area of the Power BI interface is the ‘Configuration panes‘. There are three of these on display by default, which can change depending on what you are viewing. They are the following:
Filters pane – Add/Configure filters to govern the data shown.
Visualisations pane – Choose visualisation type
Fields pane – Shows the field’s data source. Add data to reports by dragging fields onto the canvas.

You can collapse all panes to provide more working area on the main canvas.
If you want to learn more about Power BI, Infero Training has a Data Analysis with Power BI course that covers starting with Power BI and much more. Please get in touch to find out more.
0 Responses to “Introducing Power BI and How to Get Started”
Leave a Reply