Tag Archive for 'Microsoft Excel'

Access vs Excel: How To Choose The Right One For You

Data is a major part of life, but how do we manage it? Most use Excel, some use Access. Both have their similarities. So Access vs Excel, which should we choose?

Microsoft Access vs Microsoft Excel

Contents

To jump right in, both programs can store large amounts of data, run powerful queries and perform sophisticated calculations to return the desired results.

To put things extremely simply, you use Excel for data analysis and Access for data management.

Still, if we want to know which piece of software, specifically, might be helpful for our particular needs, it’s useful to look at the benefits of both programmes.

(Note: All Microsoft Office suites include Excel, but not all suites include Access.)

1. Access vs Excel: Advantages

1.1 Advantages of Excel

Excel is a spreadsheet programme and one of the most used applications in the world, with many benefits of use:

1. Easy to Learn: Excel takes relatively little time and effort to learn. Although Excel has many advanced functions that take longer to master, you can quickly pick up the fundamentals.

2. Data Visualisation Capabilities: Excel has an incredible number of options for visualising data, including PivotTables, graphs and charts, which you can customise however you wish. 

3. Formulas and Functions: Excel formulas can do almost anything, from simple numeric calculations to very complex analyses.

4. Flexibility: Although designed for Data analysis, Excel can be (and has been) used for almost any task

(Follow this link for our beginner’s guide to Excel)

1.2 Advantages of Access:

Access is a Microsoft database management system (DBMS) used for both small and large databases.

1. Relational Database: Access allows you to relate data in one table to data in different tables. Information can be stored in one table and referenced in another.

(NB: It is also possible to have a relational database model in Excel, but this involves using Excel’s more advanced functionality.)

2. Reporting Capabilities: Access has possibly the best report-generating capabilities of any of the members of the Microsoft Office suite.

3. Storage Capacity: Access is built to handle enormous amounts of data as a database system. It can also differentiate between different types of data.

4. Data Validation: Access allows you to check or validate data in your databases as you enter it by using validation rules.

To decide if Access or Excel is best for your needs, you can consider the following questions:

5. Flat versus relational data: Is your data relational? Data contained in a single table or worksheet is called flat or nonrelational data. In a relational database, you organise your information into multiple tables.

6. Local versus external data: You can use Access to connect to data from various external data sources to view, query, and edit that data without having to import it. You can also use Excel to connect to multiple data sources (including Access), but you cannot edit the source data through the Excel user interface.

7. Data integrity versus flexibility: Access requires unique identifiers within any Table, which help preserve the integrity of your data and which are used to relate records in one table to records in another. Excel lets you enter data more freely, although it is possible to control data entry using the Data Validation command.

8. Multi-user collaboration: Access lets multiple users open a single database simultaneously because it locks only the data that another user is editing. In Excel, you can share a workbook with other users, but collaboration works best when users work on data at different times, not simultaneously.

You can also ask which data analysis tools would best suit your purpose:

9. Querying: Access allows the creation of complex queries to view your data in various ways, retrieving only the rows and columns of data you want, whether the data is contained in one or many tables.

10. Modelling? Excel has what-if analysis tools that allow you to run different scenarios on your data, such as best-case and worst-case scenarios. No similar feature is available in Access.

11. Pivoting and charting? Excel provides PivotTable reporting and advanced charting features. Although Access can produce pivoted (Crosstab) reports and has some charts available, they are not as sophisticated as those in Excel.

(Follow this link for our beginner’s guide to Access)

2. Access vs Excel: When to Use Them

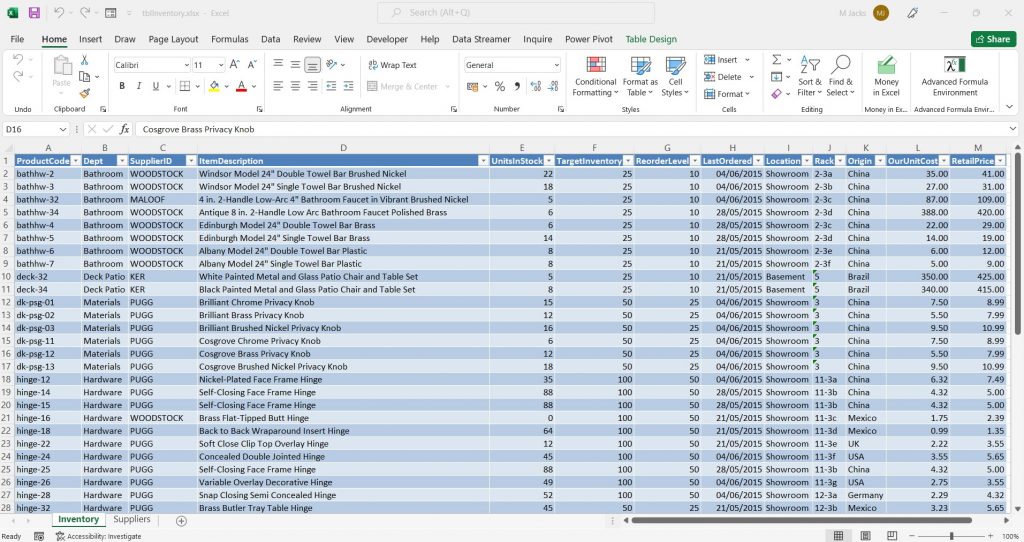
2.1 When to use Excel

Excel is incredibly flexible and can store data like Access, but is optimised for data analysis and calculation. Use Excel when you:

  • Only need a flat or nonrelational view of your data.
  • Run calculations and statistical analysis.
  • Want to use PivotTable reports.
  • Create charts regularly.
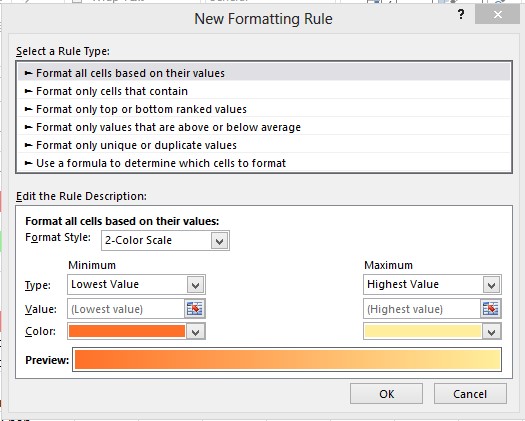
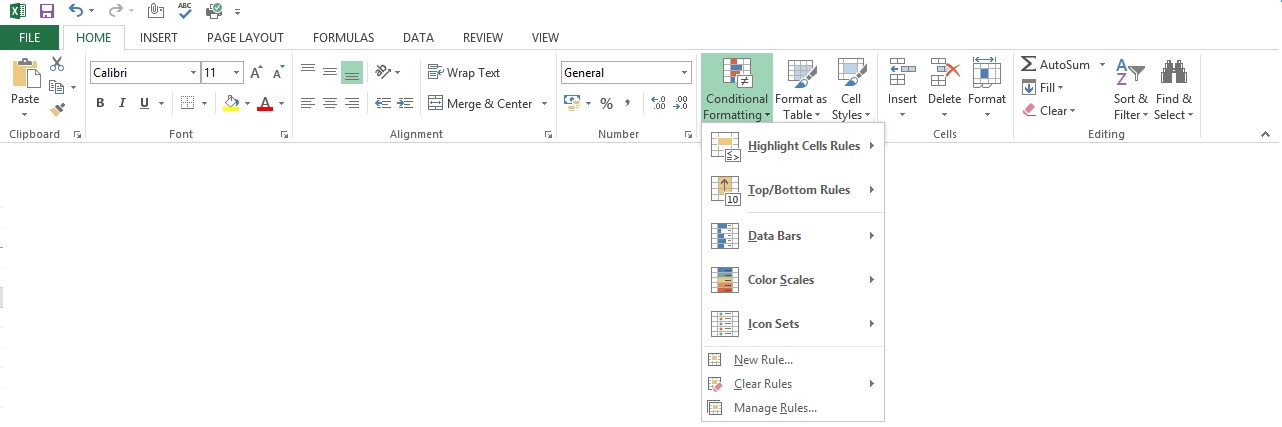
  • Want options to emphasise your data, like conditional formatting icons, data bars, and colour scales.

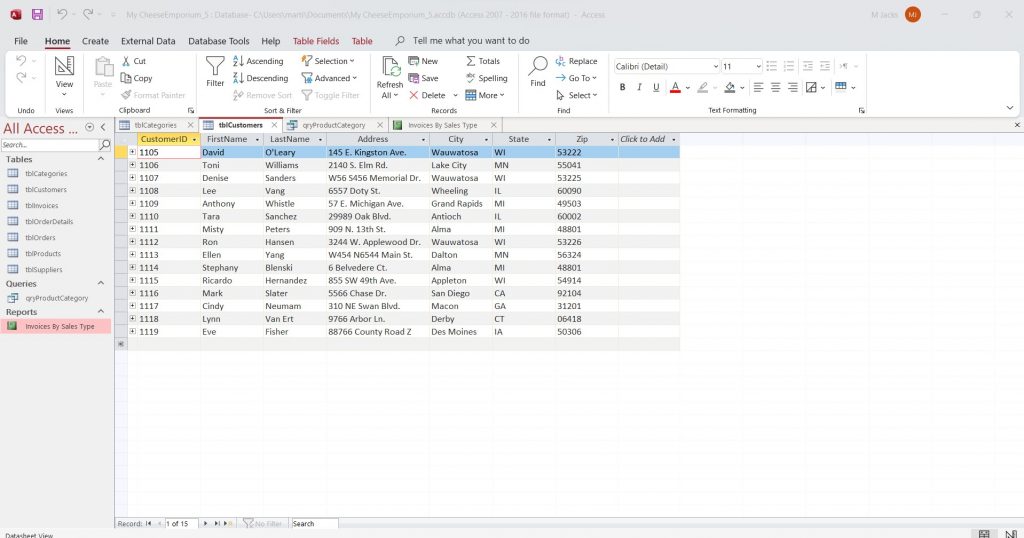
2.2 When to use Access

Very generally, Access is the best choice when you track and record data regularly, and need to export or produce reports for subsets of that data. Use Access when you:

  • Have multiple users.
  • Will be adding more tables to a data set.
  • Want to run complex queries.
  • Want the ability to produce complex reports.

3. Using Access and Excel together

Of course, it is not necessarily an either/or choice. There may be times when it makes sense to take advantage of both programs’ benefits. It does not matter which program you have used first. There are built-in tools to bring data into Access from Excel (and vice versa) by copying, importing, or exporting it.

If you use Access to store your data and Excel to analyse it, you can benefit from both of these excellent pieces of software.

If you would like to learn more about either software, we provide certified training courses tailored to you and your requirements. Get in touch with us today for a free, no-obligation consultation.

Barker Gate
Nottingham, NG1 1JU

Excel Tip: Conditional Formatting

Conditional formatting is a feature within Microsoft Excel which is used for highlighting cells with a certain color, depending on the cell’s value. It can be a great tool for your Excel sheets, as it has various purposes and outcomes, whether you are after the top 5 values or a simple way to values that need your urgent attention.


To get to conditional formatting, go to the Home tab, then to the Styles command group:

conditional formating


There are plenty of in-built options for users who don’t want to modify anything or want to do things on the go. However, Excel gives users the chance to customize their own rules for conditional formatting for that added personal touch.


Conditional Formatting


To customize your own rules, follow the same steps above, select the New Rule command to bring the New Rule Dialogue Box.


Want to learn more? Check out our Courses and our other Hints and Tips


Microsoft Excel: Your Christmas List

Christmas is nearly upon us and we know how stressful it can be trying to budget and keep on track of finances. So here’s a helpful tip showing how you can use Microsoft Excel to plan ahead.


Using Excel create you Christmas List. The one below is from one of our staff:


Christmas List 1


Using “=SUM(D5:D11)” we have calculated the total cost that has been spent on the presents.  With a small budget of £100 we can also calculate what’s left to spend.


Now using the Filter function in the Data tab we can see what has been bought for each person. This works great if you have many presents like Santa.


Now when you click the down arrow next to “Who for?” we get the options below.

Christmas List 4


Below we can see what happens when “Mum” and “Blanks” are selected. Excel counted our calculations as a default but this can be changed. Right next to the Filter button used earlier is a smaller “Advanced” button. In there you can define your range. (So Mum has 3 presents)


Christmas List 7Christmas List 8


We hope you found this helpful. Look out for more tips on our blog Microsoft Excel Tips page and on twitter www.twitter.com/infero_training

Microsoft Excel VBA Tips: How to make a message box

Using Visual Basic of Applications can make your Excel workbooks a lot more user friendly and functional. In this blog post we will be looking how to create a message box in VBA for Excel 2007, 2010, and 2013.


The first message box we will be creating will be a small message box which shows the text “Hello World”. Before we can do this, we need to enable the developer tab on the ribbon. To do this you need to Click on File > Options > Customise Ribbon > and then check the developer tab like in the image below.

 How to make a message box 1


So on the developer tab; on the left hand side you can see a coding section. This is where you can easily access the Visual Basic Software, Macros and other options.


How to make a message box 2


Clicking the Visual Basic button will open up the Visual Basic Software. When making a message box, you are unable to record a macro to make this for you. You will need to type code to do it.


Here is what the Visual Basic Software looks like.


How to make a message box 3


To write some code we need to create a module to hold the code. To do this go to the top bar, click on Insert > Module


How to make a message box 4


Once you have done that you need then to create a Procedure to hold the Message Box.

Click Insert > Procedure > Type a name > Leave it set to Sub and Public > Click OK.

Note: The name cannot have a space in it.

How to make a message box 5


In the Coding window you can then type the following to create a message box


 How to make a message box 6


To run the Procedure/Macro, go back to your Excel window. This can be done by either closing the VBA window or just minimising it.


On the Developer tab > Click on Macros and the new HelloWorld Procedure/macro will be in here.


How to make a message box 7


Highlight the HelloWorld Macro and click run. You will get a little message appear with your message inside!


How to make a message box 8

Microsoft Excel Tips: Absolute Referencing

Absolute Referencing is a forgotten tool in your Toolbox called Excel. Daily you will probably find yourself using the fill handle on excel to automatically fill tables. This is called Relative Referencing and this will change the formula/function in a cell depending on which way you drag the cell.


So the example below we have a Product List at a made up computer company.Absolute Referencing 1


As you can see in the Total Quantity Price column I used the fill handle to drag my formula down the formula to the other rows to fill in the column. Because I dragged the fill handle down the numbers row numbers increased 1 at a time.
Absolute Referencing 2


Absolute Referencing allows us to lock a formula in a cell. Let’s see this in another example.


I’ve extended my table and added a Price After Tax column. This column uses the 20% (or 0.2) number in cell H1 to add the Tax onto the Price. Using the $ before both the H and the 1 you are able to “lock” this cell down. So when you use the fill handle the cell wont change.


Instead of typing the ‘$’ in the formula you could press the F4 key on your keyboard to automatically add the ‘$’ to that cell reference.

Microsoft Excel Tips: How to Personalize your Table

When you use Excel the table can look really boring and plain; however in the newer versions (2007 and

Microsoft Excel 2007 Cell Styles Menu

2010) you are able to customize your tables by using different font styles and colours as well. There are also different shades of colour and sizes of text you can use. To change you table here’s how to do it:


  1. Click on the Cell Styles link on the toolbar
  2. This will give you a list of all the different styles that are available to you when making your table
  3. Click on the cell you want to personalize and then choose the style you want.


Want more tips; just visit our Microsoft Excel Tips page