Struggling to balance your career and well-being? Check out this blog for tips and strategies on how to maintain and improve your wellness at work.
As part of National Employee Wellness Month, we’re excited to share some valuable tips and strategies on how you can enhance your overall wellness as an employee. Remember, investing in your own self-care and happiness not only benefits you personally but also leads to increased productivity and job satisfaction.
Take time to nurture your physical, mental, and emotional well-being. Incorporate activities like exercise, meditation, hobbies, and spending quality time with loved ones into your routine. Setting aside time for self-care allows you to recharge and bring your best self to work.
Establish Work-Life Balance
Balancing work and personal life is crucial for maintaining overall wellness. Set boundaries between your professional and personal time, and make sure to disconnect from work when you’re off-duty—Prioritise leisure activities, family time, and hobbies that help you relax and rejuvenate.
Practice Mindfulness
Cultivating mindfulness can significantly impact your wellness. Practice being fully present in the moment, whether during a meeting, a lunch break, or a simple task. Mindfulness reduces stress, improves focus, and enhances decision-making abilities.
Foster Positive Relationships
Building positive relationships with colleagues and supervisors can significantly enhance your work experience. Take the initiative to collaborate, offer support, and appreciate the contributions of others. Cultivating a positive work environment promotes camaraderie and increases job satisfaction.
Take Breaks and Disconnect
It’s essential to take regular breaks throughout the workday to recharge and avoid burnout. Step away from your desk, stretch, or go for a short walk. Additionally, establish boundaries around technology usage outside of work hours to allow for true relaxation.
Seek Professional Growth Opportunities
Expanding your knowledge and skills not only benefits your career but also boosts your overall wellness. Look for opportunities to attend workshops, conferences, or webinars related to your field. Engaging in continuous learning can increase job satisfaction and open new doors for personal and professional growth.
Communicate Openly
Effective communication plays a vital role in workplace satisfaction. Express your ideas, concerns, and needs openly and respectfully. Regularly check in with your colleagues and supervisors to maintain open lines of communication and foster a supportive work environment.
Take Advantage of Wellness Programs
Many organisations offer wellness programs to support their employees’ wellness. Explore the wellness initiatives available in your workplace, such as fitness classes, mental health resources, and stress management workshops. Participating in these programs can positively impact your overall health and happiness.
Remember, your wellness matters, and investing time and effort into self-care ultimately benefits both you and your work environment. By implementing these strategies, you’ll be well on your way to improving your overall wellness as an employee.
Here at Infero, we run many technical courses that assist you in progressing your career journey, but also ones that will teach you how to do this healthily. These include;
Stress Management
Achieving Life Balance
Emotional Intelligence Works
Managing Conflict
Get in touch for more details, and we wish you a balanced and fulfilling work-life journey!
A memory like a sieve…It’s a relatable phrase describing how we forget things we’ve just learnt. So, how do we retain information and improve how we learn?
The word learn is interesting because it can evoke a variety of feelings. There may be the fear of failing and ambivalence towards a tedious and frustrating process in the early days. Still, there’s also a lot of excitement and pride in learning a new skill as it shows that we are developing and investing in ourselves.
We live in an instant world with so much information accessible at the press of a button or even through a voice command. If we are interested in starting a new hobby, there will doubtless be numerous articles, guides, classes, apps and youtube videos to get us started.
Technology has given us the expectation of immediacy, but learning is biological, with no shortcuts or fast-tracking.
It takes effort and repetition to use the information and then apply it. But,learning to learn can improve multiple aspects of our life, such as academic performance, mental health and physical capabilities.
So, how do we learn?
Let’s start with biology!
A large part of learning is our ability to remember.
When we learn something, our brains create new brain cells that form connections. The more we repeat an activity and reencounter or recite a fact, the stronger brain cell connections get and the faster we can recall the action or information.
However, there’s also a time element at play.
Connections get stronger with repetition, but if what we’ve learnt is not reused within a specific time window, the associated brain cells and connections break down. What we’ve learnt is forgotten.
To our utter dismay and consternation, we’re back to square one.
Why? Despite what our desktop files might imply, our brains have evolved to be very efficient at decluttering.
It keeps what it deems useful and prunes the rest; use it or lose it. What isn’t repeated isn’t worth keeping.
Therefore, at the beginning of learning something new, frequently practising and repeating the activity is key to strengthening cell connections. This prevents the connections and cells from breaking down. However, as connections become stronger, the action doesn’t need to be repeated as frequently.
For example, we may need to practice something daily before it has entirely been committed to memory and then weekly to maintain it and then monthly and yearly to continually refresh the connections. Although, even after this, if we spend years without repeating the activity, it still won’t stand the test of time.
What’s the best way to learn?
Now we understand the link between memory and learning, what’s the most efficient way to learn and build a new skill? Spaced repetitionis thought to be the answer.
During school, university, and work, we are asked to take in lots of information about a subject over a few months and tested on it. We reach a level of competency and then may never use this information again.
Or, even worse, be expected to recall it a few years later. In this case, it is likely the skill will need to be completely revisited and relearned entirely, which is time-consuming and frustrating.
We often ‘cram’ information, using our short-term memories and not learning to retain it in the long run. In a way, our brains our like muscles. Expecting to do a month’s worth of training to run a 5k in one day is impossible.
Spaced repetition
Instead of overloading and tiring our brains, the spaced repetition technique builds strong memories using active recall over optimally spaced intervals.
At the start of learning something new, we can recall information nearly perfectly. As time goes by, it will all be forgotten. Spaced repetition addresses this by recalling information again before it is completely forgotten.
Additionally, each time the information is recalled and some is partially forgotten, the memory becomes even stronger and the interval between needing to recall the information becomes shorter.
The number of repetitions and time intervals depend on the complexity of what is being learned and the individual. The idea is to store the information as long as possible and reduce memory decay.
It is a technique that improves long-term memory, unlike rote learning and cramming. Spaced repetition also encourages our brains to contextualise information and connect with something we already know.
Therefore, memorisation techniques are at the forefront of getting the most out of what we have learnt. It’s time-consuming and requires patience, but worth it in the long term!
At Infero Training, education and self-development are at the heart of what we do. Our courses have been developed and designed to optimise learning. We offer post-course support and further tools so you can revisit what you have learnt (a bit of spaced repetition, anyone?).
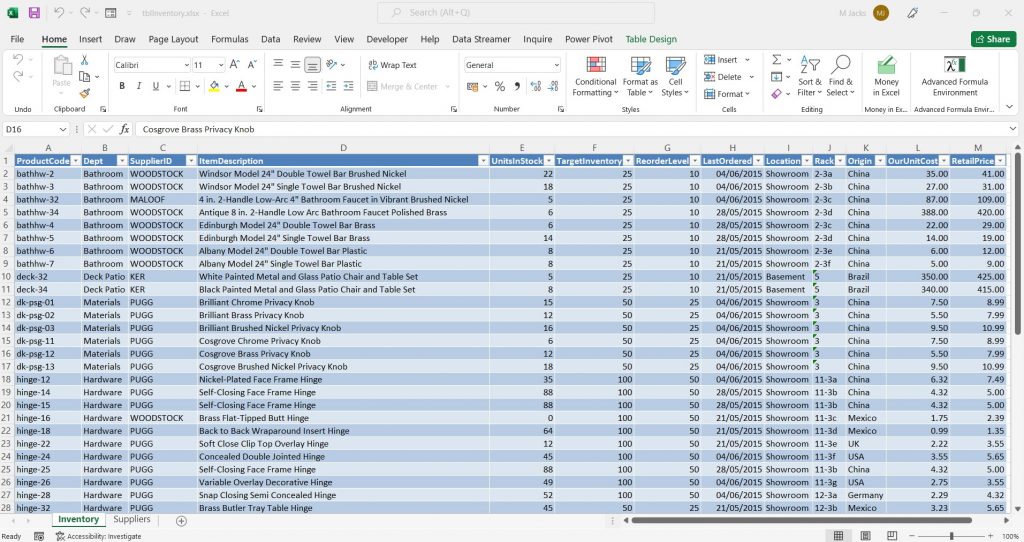
How frustrating is it when you scroll across a spreadsheet, and all the useful information disappears? Give your memory a break with the excel freeze function!
Excel is an incredible tool for storing and managing data. However, scrolling across or down a spreadsheet is inevitable when dealing with magnitudes of cells. It would be ever so helpful to see the column and/or row titles while navigating other areas of the spreadsheet to make sense of and compare data.
BAM! In walks the Excel freeze function to save us all from repetitive strain injury.
Excel Freeze Function
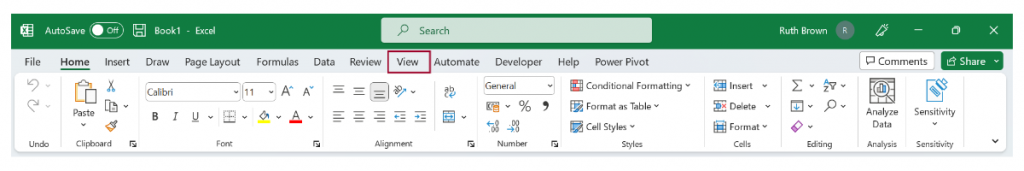
So where can you find this handy tool?
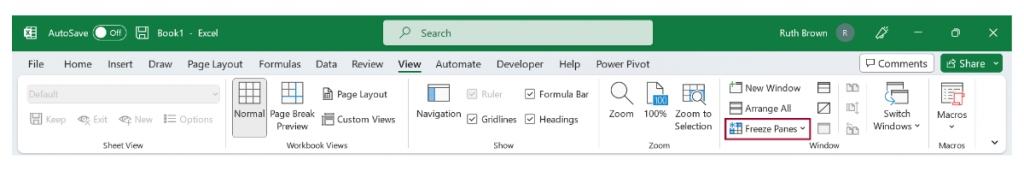
From the open spreadsheet, select the ‘View‘ tab and then the ‘Freeze Panes‘ function, which is found in the ‘Window’ group of the View tab (Select View > Freeze Panes).
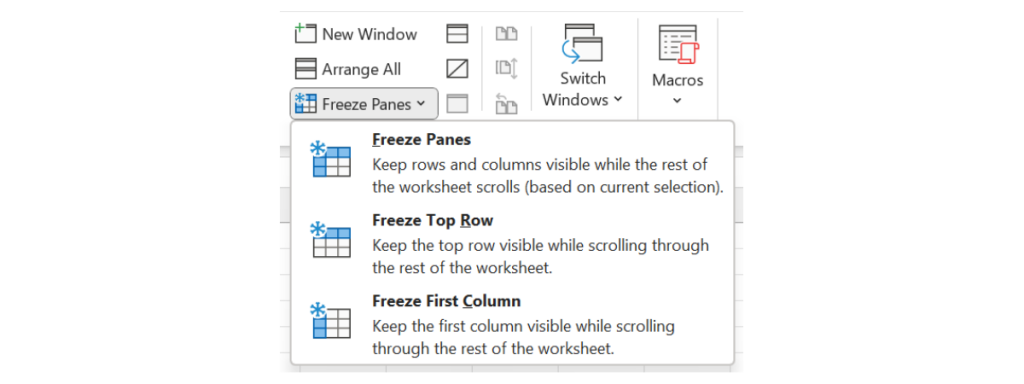
From here, you can see three options:
Freeze Panes
Freeze Top Row
Freeze First Column
Step 1. Select View
Step 2. Select Freeze Panes
Freeze Pane Options
To get to grips with how to use the different Freeze options, check out the examples below!
1. Freeze Top Row
From freeze panes, select ‘freeze top row’.
Excel will automatically freeze the first row of the spreadsheet, which is indicated by a dark grey horizontal line beneath the first row.
2. Freeze First Column
From freeze panes, select ‘freeze first column’.
Again, Excel automatically freezes the first column of the spreadsheet, which is indicated by a dark grey vertical line to the right of the first column.
3. Freeze Panes
The above are extremely straightforward but don’t allow much flexibility. Freeze panes is slightly more complicated but gives more freedom.
For example, you can freeze multiple rows, multiple columns or multiple rows and columns.
3.1 Freezing multiple rows
If you were looking to freeze a certain number of rows, select the row below the last row you want to remain visible and select freeze panes.
For example, if you want the first three rows to remain visible, select row four and freeze panes.
A dark grey horizontal line above row four and below row three indicates that these first three rows will remain visible whether you scroll up or down.
3.2 Freezing multiple columns
Freezing multiple columns is similar to the above example of freezing multiple rows.
Select the column to the right of the columns you want to remain visible and select freeze panes.
For example, if you want the first three columns to remain visible, select column four and freeze panes.
A dark grey vertical line to the left of column four and the right of column three indicates that these first three columns will remain visible whether you scroll left or right.
3.3 Freezing rows and columns
But what do we do when we want to freeze columns and rows?
Instead of selecting an entire row or column, we set one cell that controls which columns to the left and rows above are visible.
For example, if we want to freeze the first row and column, select the cell two rows down and two columns across (B2).
A dark grey vertical line to the left of the cell and a dark grey horizontal line above the cell indicates that the first row and column will remain visible whether we scroll across or down the spreadsheet.
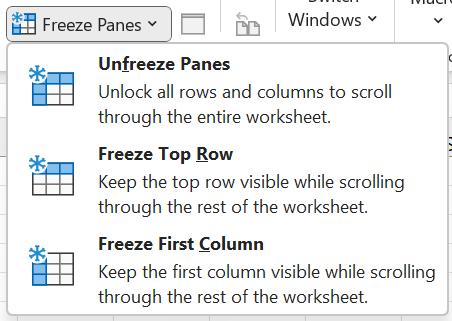
4. Unfreeze Panes
After applying one of the three Freeze Pane options, the top Freeze Pane option will be replaced with ‘Unfreeze Panes‘. Simply select this to remove all columns and rows that have been frozen.
Unfreeze Panes
Thanks for reading, and we hope this helped! For more tips and tricks, check out our other blogs here!
Want more hands-on training? Infero also offers multiple Excel courses that will take you from beginner to pro. Get in touch for more information, book a course or receive a free consultation using the details below!
Unsurprisingly, presentations are a commonly dreaded method of communication, but it’s just a case of understanding the basics and putting them into practice.
Presentations are the default communication tool in the business world; more than 25% of people see at least one presentation daily. Nevertheless, if the thought of delivering a presentation gives you nightmares, don’t worry; that’s completely normal. Public speaking may seem daunting, but there are many strategies you can use to deliver a successful and engaging presentation.
“You can have brilliant ideas, but if you can’t get them across, your ideas won’t get you anywhere.”
Lee Iacocca
Good presentations start with the content. It doesn’t matter what your message is; if it can’t be communicated, it just won’t work. Every audience is different, but if you research your topic and practice, practice, practice, you will connect with them successfully.
1. Qualities of Great Presentations
Some of the things that audiences appreciate in a presentation are:
Relevant content and well-organised content
Creativity
Audience involvement
Relevant examples
Time for questions
Reasonable duration
Interesting visuals
Humour
Clear and understandable language
2. Worries When Giving presentations
The most common worries people have in business presentations include the following:
Not being able to speak.
Forgetting your subject matter.
Having a heckler or know-it-all in the audience.
Having people notice your anxiety.
Not being able to answer an audience question.
But these concerns are all surmountable! The more presentations you deliver, the more you will know how to handle these issues.
3. Delivering an Effective Presentation
If you want to get your message across with impact, remember that how you deliver your presentation is as important as its content. Here are some tips to help with your next presentation and hopefully eliminate stress. Using these strategies, the audience will fully engage and leave positively, not feeling they have just endured another ‘Death by PowerPoint’.
Keep Presentations simple
Your presentation’s ideas must be accessible and easy to follow; simplicity is vital. Less is more, and you should try to keep the amount of text on any slide to an absolute minimum. Ensure you are clear on the key information you want people to take away. Keep your main ideas to three or fewer points, and repeat these at the start and end of your presentation so that your audience remembers the most important message.
Start Strong
A strong beginning draws people in, just as in a book or movie and a solid, entertaining opening makes it much more likely that your presentation will be well-received. Some ways to achieve this include:
Showing a video as the introduction to your presentation
Making a statement that surprises your audience
Posing an interesting question or problem
Using an interesting or thought-provoking quote
Having an unexpected statistic or image.
Remember, again, that whatever you use to start your presentation needs to be relevant and support the core message you are trying to convey.
Create an Easy-To-Follow Structure
A logical, easy-to-follow structure seems obvious, but we sometimes lose this when putting a presentation together. Try to put yourself in the position of an audience member who knows little or nothing about the subject. Make sure there is an organised flow and logic to the presentation. The best and simplest structure is to break your presentation into three sections: an introduction, a body, and a conclusion.
Introduction – states your core message and explain why it’s useful or relevant to your audience.
Main body – provides the facts, quotes, and evidence to back up your main points.
Conclusion – reiterates your core message and tells the audience how they can put into practice what they’ve just learned.
Remember to be brutal with your material. Cut everything you don’t need and rearrange the presentation’s structure if necessary.
Use Visuals in Presentations
Integrating colours, images, graphs, video clips, photographs and infographics will add life to your presentation. If concepts can be better supported or explained using a visual aid, then use them in your presentation. You can often use a visual instead of a block of text. But don’t overload your slides with visuals or use them if they are irrelevant. Simplicity is key; if visuals make things more complex, leave them out. And, as a rule of thumb, avoid animations in slides.
Use Simple and Effective Slide Design
Good slide design can distinguish between a good presentation and one that fails. Simple considerations will improve your design:
Use colour sparingly and stick with one or two colours, so your presentation has a consistent look and feel.
Font consistently is key! Don’t switch between caps and lowercase. Stick with one font and size throughout your slide deck, although you can vary the size (sparingly) for emphasis.
Take time to format. Ensure your text is aligned and neat and that images are placed and spaced appropriately. And once again, keep it simple.
Tell Stories During Presentations
Telling a life story or some other anecdote makes you more relatable. Your audience will feel more connected and comfortable with you. This will also have the benefit of making you feel more relaxed. Stories add context and help the audience understand the points in the presentation, but ensure you only tell stories that support your main ideas.
Tailor it to Your Audience.
What do you know about your audience? The more you know, the better. What is their level of knowledge on the subject? Are they interested or involved in it? The key to landing a successful presentation is knowing ‘What’s In It For Them’. Many presenters seem to forget that the presentation is for the audience. It is not to showcase the presenter. Put your audience first, middle and last in everything when preparing your material.
Practice and Prepare Presentations
Practising a presentation may not be the most natural thing, but it is very helpful. You can try running through the presentation in front of a mirror or a small audience. Ask for honest feedback and take any comments on the board positively.
Try to run through the presentation a few times, at least once in the space where you will deliver it, if possible. Knowing the structure and content of the material will significantly benefit the delivery. Don’t try to memorise your speech verbatim, however. It is very easy to get hung up on getting a presentation word-for-word perfect, and forgetting something can throw you off track. Practice, as with everything, will make your presentation better.
Did you know that Steve Jobs used to take two days to prepare a 20-minute presentation?
Be Passionate About the Topic
Suppose you show you are genuinely excited about the subject and display your interest. In that case, this will engage the audience and capture their attention. People like to listen to presenters who are excited about sharing their knowledge.
Maintaining eye contact during your delivery also strengthens your connection with the audience. And smile. It will go a long, long way.
Take A Breath and Slow Things Down
When we are nervous, we tend to rush. If this happens, pause, take a breath and force yourself to go slower. It’s far better to go slower and take more time to get across everything you want to instead of leaving your audience more confused.
Be honest and authentic during your delivery, and be conversational with your audience. Always talk “to” your audience instead of “at” them.
Use a Remote
Using a remote will mean you can face the audience and not have to keep returning to your laptop to advance slides. It also helps you keep control of the pace of delivery.
Have Backup Material
You may need to fill in extra time or an activity if equipment goes wrong. You may find that your audience already knows some of the things you were going to tell them or that the material is irrelevant. Always prepare something extra to fall back on. Preparing for all eventualities will help soothe your nerves and allow you to feel more in control.
Be Yourself
People will quickly spot a lack of authenticity. Don’t attempt to impress the audience or be something you are not. Get the point across as you see it, simply and honestly. That is the whole point of the presentation.
If you can, use humour. Telling a funny story really makes a presentation work. It makes people remember your message, but if that’s not you or it is not working, then avoid this.
Finish Presentations on a High
Wrap up your presentation by focusing on the feeling you want the audience to take home.
“They might forget what you said, but they’ll never forget the way they made you feel”
Maya Angelou
If there is a message you want the audience to remember, then say it slowly and leave a pause at the end. Silence and pauses are much more powerful than you realise and make what you have said meaningful.
Also, using a call-to-action ends your presentation with strength and impact. Let your audience know precisely what you want them to do next.
Infero offers an Effective Presentations course that covers all you need to know to help you give the best presentations possible. For more tips and tricks on presentations, look at our blogs below!
Don’t let your business’s data go to waste! Power BI allows you to make data-driven decisions toachieve your company goals and propel your business forward.
Power BI is a powerful and easy-to-use Data Visualization and Business Intelligence tool. It can take data from different, unrelated data sources and combine it into incredible interactive reports and dashboards with stunning visualisations. Moreover, the desktop version of Power BI is wholly and entirely free.
BI: (business intelligence) refers to taking raw data and transforming it to create reports that can aid in making informed business decisions. Data visualisation uses visual elements such as charts, graphs, maps, and other illustrations to analyse and find patterns and insights in data. Microsoft’s “Power BI” comprises several products and services, which include:
Microsoft Power BI Pro – A paid online service that allows users to view dashboards with a web browser and collaborate and share data.
Power BI Mobile – A free mobile version that allows a secure connection and interaction with dashboards and reports on the go.
Microsoft Power BI Desktop – A free desktop report authoring tool that can connect to more than 70 different data sources. It’s typically known for its eye-catching visualisations, dashboards and reports.
With Power BI Desktop, you can:
Get data from a wide variety of data sources and shape the data to match your reporting needs.
Create relationships between your data and change data formats
Create reports choosing from dozens of visualisations with almost limitless formatting options.
Save your reports as a Power BI Desktop file.
Upload or publish your reports
Where to download Power BI
Power BI Desktop is available in both 32-bit and 64-bit versions. To download the latest version, you can use the following link.
Or you can use this link to download the Power BI files directly.
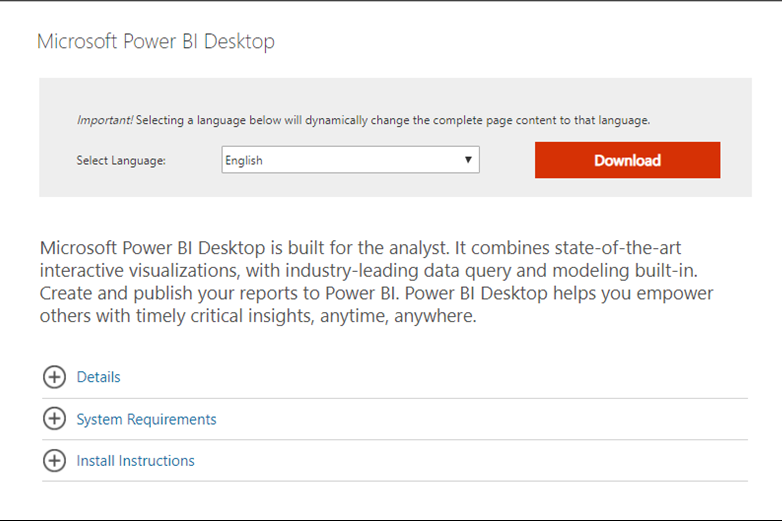
After clicking the link, you can choose the language you want to download the software. There are details on system requirements and installation instructions.
Download Microsoft Power BI Desktop
Power BI – The Main Tools
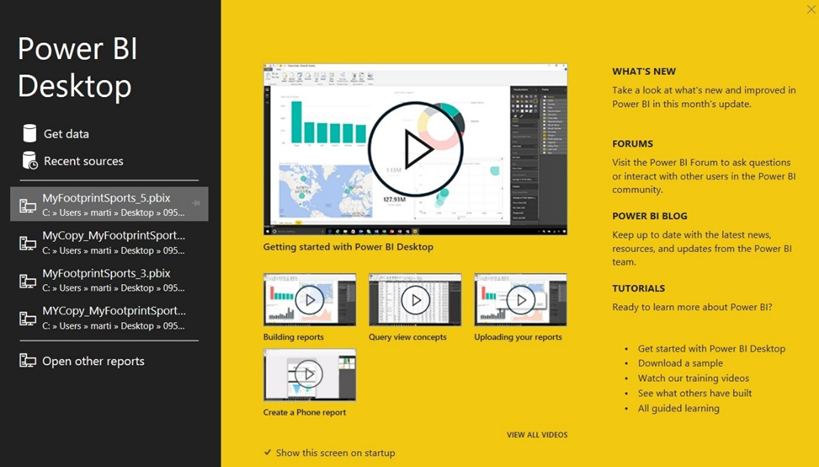
1. Welcome window
When Power BI is installed and opened, it launches a welcome screen. From here, it is possible to open data sources, see any new developments in the programme and access tutorials.
Microsoft Power BI Welcome Screen
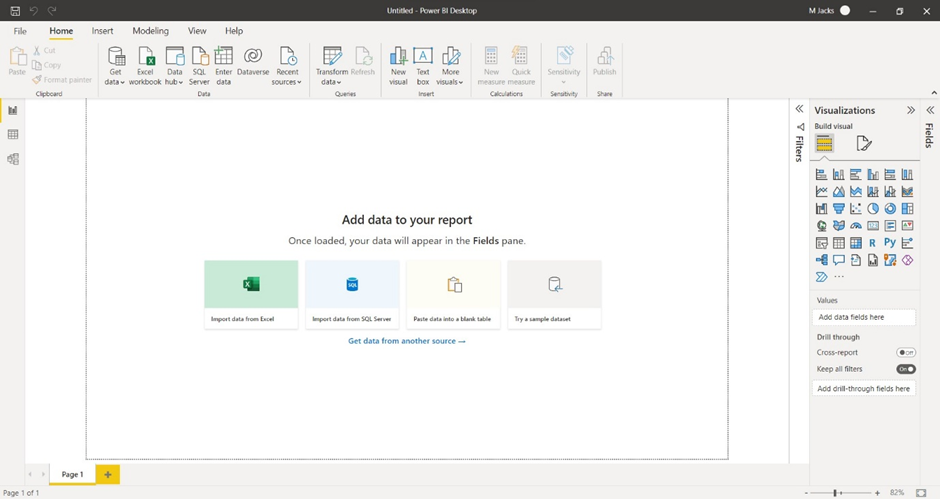
2. Power BI main interface
You will see the main Power BI Interface after closing the welcome screen.
Microsoft Power BI Main Interface
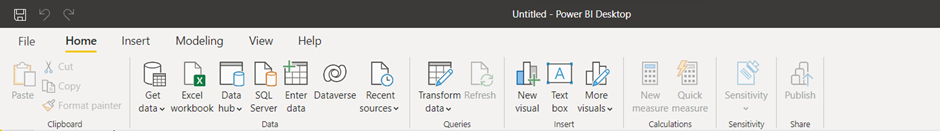
The Power BI interface, on first look, seems slightly different to other MS Office products. Still, it has many familiar elements, such as the ribbon with tabs and groups of command buttons.
Power BI Ribbon
3. Data sources
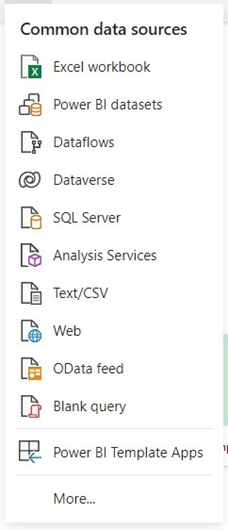
To access all of the various options regarding data sources, select the ‘Get data’ command located in the Data group of the Home tab. The command will display a list of ‘Common data sources‘.
Power BI Common Data Sources
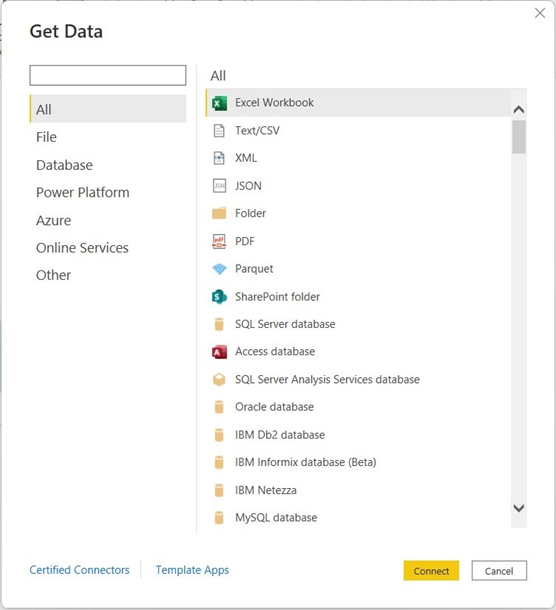
Clicking ‘More…‘ in this list will open a dialogue box that lists all the possible sources from which Power BI can access data.
Power BI Data Source List
Here you can connect to different flat files such as Excel Workbooks and Text files, sources such as an SQL database, and web platforms such as Facebook, Google Analytics, and Salesforce objects.
BI is about providing the right data at the right time to the right people so that they can take the right decisions.
Nic Smith with Microsoft BI Solutions Marketing
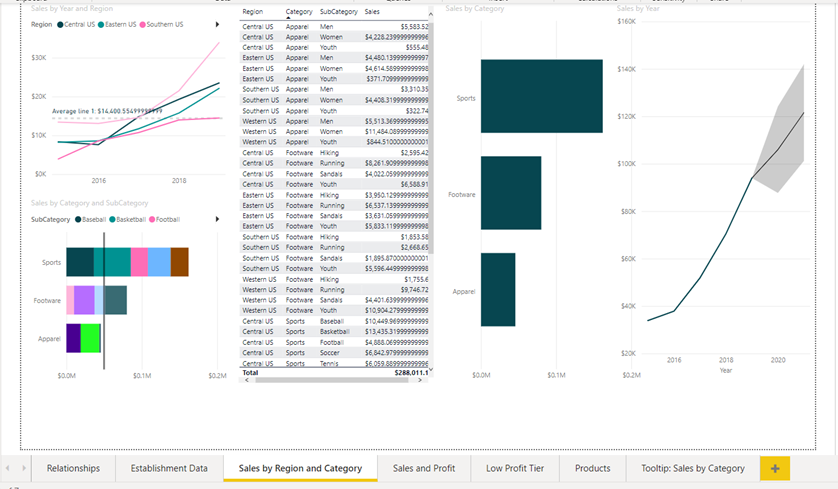
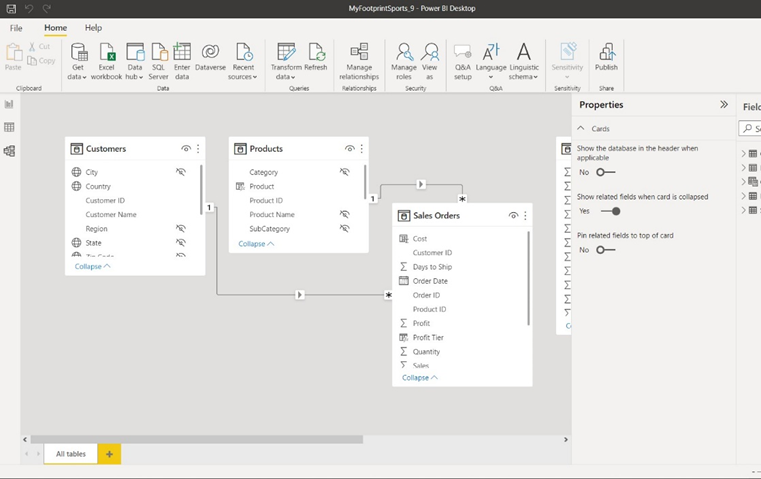
4. Power Bi Canvas
The most used area is known as the ‘Canvas‘. You can create and configure reports, data, relationships, and dashboards here.
Power BI CanvasView
By default, Canvas displays the Report View, which shows visualisations and reports, but you can change the view by selecting the View selection icons on the left side of the Power BI interface.
View Selection Panel
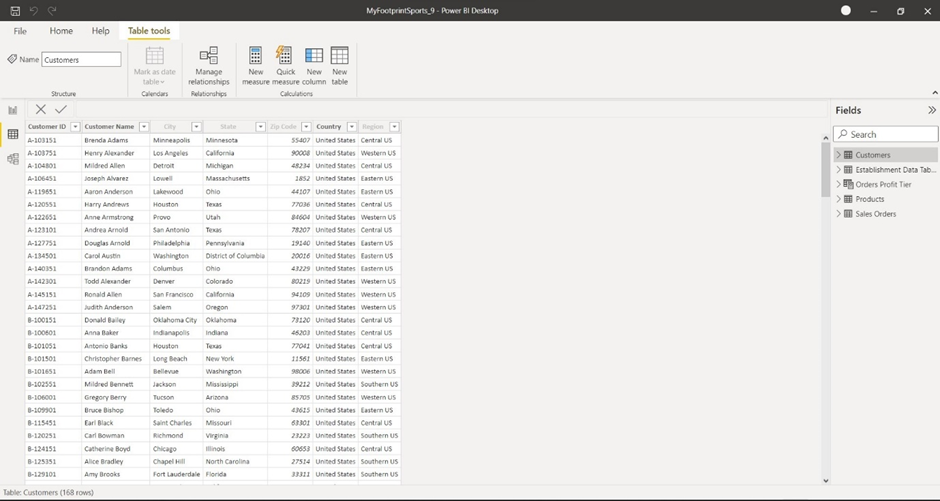
Choosing the ‘Data View‘ will display the data tables from your data sources.
Power BI Data View
The ‘Model View‘ will show any relationships between the different tables of Data.
Power BI Model View
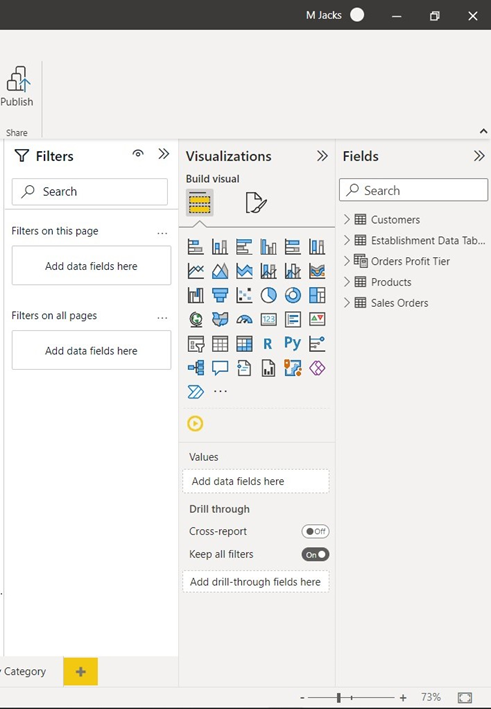
5. Configuration panes
The last main area of the Power BI interface is the ‘Configuration panes‘. There are three of these on display by default, which can change depending on what you are viewing. They are the following:
Filters pane – Add/Configure filters to govern the data shown.
Visualisations pane – Choose visualisation type
Fields pane – Shows the field’s data source. Add data to reports by dragging fields onto the canvas.
Power BI Configuration Panes
You can collapse all panes to provide more working area on the main canvas.
If you want to learn more about Power BI, Infero Training has a Data Analysis with Power BI course that covers starting with Power BI and much more. Please get in touch to find out more.
Most adults struggle to maintain a healthy work-lifebalance at some point in their lifetime, but how can you tell if your scales are uneven?
Think about your hobbies. When was the last time you committed time or effort to them? Do you frequently feel like you can’t afford the time or energy to enjoy the rest of the day after work?
You’re not alone. Many of us struggle with this feeling; how did we ever have time for anything other than the mundane??
Time for ourselves seems fleeting with the growing responsibility as we get older and further in our careers. But how do we know if this is a natural realignment with changing values or a sign that something could be wrong?
What is a healthy work-life balance?
A healthy work-life balance is more than giving equal weight to our careers and the fun parts of our personal lives.
It’s about finding the balance between everything that constitutes a healthy and fulfilling lifestylewhich includes;
adequate sleep and rest,
balanced, nutritional meals,
regular exercise,
social interactions,
good hygiene and personal care,
a positive and self-supportive attitude.
However, this isn’t likely new or groundbreaking information.
We can all list the things that constitute a healthy lifestyle, but juggling this and work can be challenging.
This is especially true if you struggle with perfectionism, time management, health problems, or a demanding work environment/employer.
However, to have balance, we should give equal importance to the essential aspects of our lives, not investing all our energy in one thing and neglecting other significant parts.
It is also essential to understand that equal importance does not mean equal time.
It’s about dedicating enough time to each essential activity so that we feel we are content and achieving our goals.
A healthy work-life balance is, therefore, highly individual as it will vary from person to person depending on their responsibilities and ideals.
So how do you know if you have one?
What are the red flags you should be aware of
An excellent exercise to gauge your work-life balance is taking a step back and allowing time to pause, reflect and assess your current emotional, physical and mental well-being.
Do you feel content and that you’re leading a fulfilling life that aligns with your values, or do you relate more to the statements below?
1. Often experiencing emotional, physical and mental exhaustion.
2. Finding yourself increasingly negative, irritable and resentful.
3. Frequently feel overwhelmed, trapped, or pulled in different directions.
4. Struggling to or unable to maintain healthy relationships.
If the answer is a resounding yes, it might be time to explore whether you could improve your work-life balance and the quality ofyour life.
First Step: Realise to prioritise
If you relate strongly to the above statements, reflect further and envision your ideal life.
How does this look? What are you doing less of or more of? What values, experiences, interactions, or activities have you identified that contribute to your fulfilment?
Bare in mind that this is different to fantasising about what you would do if you won the lottery. It’s about reflecting on your life and the changes you can make that are achievable and within your means.
The next step is to analyse the list of things you find fulfilling and identify the ones that are essential and have the most significant value to you.
Once you understand what contributes to your ideal lifestyle, it is easier to prioritise how you spend your free time and the steps you can take to create a daily, monthly and yearly routine that fulfils your goals.
If you want more tips about achieving a healthy work-life balance, keep an eye out for our upcoming blogs discussing this and a deeper dive into why we can get trapped in the cycle of working too many hours.
For those who frequently suffer from burnout and feel like they want to make a change, we offer time and stress management courses that train you to support you in balancing life and work.
Data is a major part of life, but how do we manage it? Most use Excel, some use Access. Both have their similarities. So Access vs Excel, which should we choose?
To jump right in, both programs can store large amounts of data, run powerful queries and perform sophisticated calculations to return the desired results.
To put things extremely simply, you use Excel for data analysis and Access for data management.
Still, if we want to know which piece of software, specifically, might be helpful for our particular needs, it’s useful to look at the benefits of both programmes.
(Note: All Microsoft Office suites include Excel, but not all suites include Access.)
1. Access vs Excel: Advantages
1.1 Advantages of Excel
Excel is a spreadsheet programme and one of the most used applications in the world, with many benefits of use:
1. Easy to Learn: Excel takes relatively little time and effort to learn. Although Excel has many advanced functions that take longer to master, you can quickly pick up the fundamentals.
2. Data Visualisation Capabilities: Excel has an incredible number of options for visualising data, including PivotTables, graphs and charts, which you can customise however you wish.
3. Formulas and Functions: Excel formulas can do almost anything, from simple numeric calculations to very complex analyses.
4. Flexibility: Although designed for Data analysis, Excel can be (and has been) used for almost any task
Access is a Microsoft database management system (DBMS) used for both small and large databases.
1. Relational Database: Access allows you to relate data in one table to data in different tables. Information can be stored in one table and referenced in another.
(NB: It is also possible to have a relational database model in Excel, but this involves using Excel’s more advanced functionality.)
2. Reporting Capabilities: Access has possibly the best report-generating capabilities of any of the members of the Microsoft Office suite.
3. Storage Capacity: Access is built to handle enormous amounts of data as a database system. It can also differentiate between different types of data.
4. Data Validation: Access allows you to check or validate data in your databases as you enter it by using validation rules.
To decide if Access or Excel is best for your needs, you can consider the following questions:
5. Flat versus relational data: Is your data relational? Data contained in a single table or worksheet is called flat or nonrelational data. In a relational database, you organise your information into multiple tables.
6. Local versus external data: You can use Access to connect to data from various external data sources to view, query, and edit that data without having to import it. You can also use Excel to connect to multiple data sources (including Access), but you cannot edit the source data through the Excel user interface.
7. Data integrity versus flexibility: Access requires unique identifiers within any Table, which help preserve the integrity of your data and which are used to relate records in one table to records in another. Excel lets you enter data more freely, although it is possible to control data entry using the Data Validation command.
8. Multi-user collaboration: Access lets multiple users open a single database simultaneously because it locks only the data that another user is editing. In Excel, you can share a workbook with other users, but collaboration works best when users work on data at different times, not simultaneously.
You can also ask which data analysis tools would best suit your purpose:
9. Querying: Access allows the creation of complex queries to view your data in various ways, retrieving only the rows and columns of data you want, whether the data is contained in one or many tables.
10. Modelling? Excel has what-if analysis tools that allow you to run different scenarios on your data, such as best-case and worst-case scenarios. No similar feature is available in Access.
11. Pivoting and charting? Excel provides PivotTable reporting and advanced charting features. Although Access can produce pivoted (Crosstab) reports and has some charts available, they are not as sophisticated as those in Excel.
Excel is incredibly flexible and can store data like Access, but is optimised for data analysis and calculation. Use Excel when you:
Only need a flat or nonrelational view of your data.
Run calculations and statistical analysis.
Want to use PivotTable reports.
Create charts regularly.
Want options to emphasise your data, like conditional formatting icons, data bars, and colour scales.
2.2 When to use Access
Very generally, Access is the best choice when you track and record data regularly, and need to export or produce reports for subsets of that data. Use Access when you:
Have multiple users.
Will be adding more tables to a data set.
Want to run complex queries.
Want the ability to produce complex reports.
3. Using Access and Excel together
Of course, it is not necessarily an either/or choice. There may be times when it makes sense to take advantage of both programs’ benefits. It does not matter which program you have used first. There are built-in tools to bring data into Access from Excel (and vice versa) by copying, importing, or exporting it.
If you use Access to store your data and Excel to analyse it, you can benefit from both of these excellent pieces of software.
If you would like to learn more about either software, we provide certified training courses tailored to you and your requirements. Get in touch with us today for a free, no-obligation consultation.
Microsoft Access arguably doesn’t share the same fame as other Microsoft products. However, it still packs a punch. Read on to find out what it can do.
Data, data, data. It’s what most businesses boil down to; it holds the secrets to success, but if improperly managed, it is the cause of problems. It needs to be stored effectively and efficiently to keep this rich source of insight and strategy working in your favour.
The solution? Databases.
This leads us to today’s menu of discussion as one of the first mass-market database programs for Windows, Microsoft Access.
What is Microsoft Access:
Microsoft Acess is a data management system (DBMS) produced by Microsoft and part of the Microsoft 365 Office Suite.
It uses a graphic user interface (GUI) and software development tools. It’s suitable for people with and without coding experience and is used to store, manage and visualise large quantities of data.
Microsoft Access is an excellent database software solution for individuals and small to medium businesses.
Applications of Microsoft Access:
Creating forms for data entry
Importing data from other databases (such as Excel)
Creating reports that you can save in a PDF format for printing and sharing
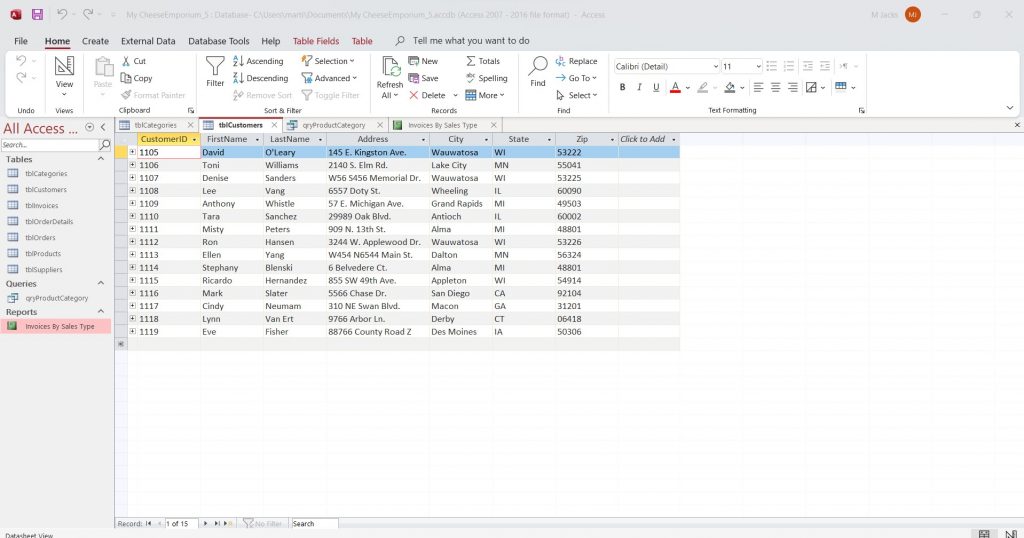
The backbone of all databases is the tables, which hold the data and information. Like Excel, you can build tables of rows and columns, each with a field name and the rows representing a record.
Creating all the necessary subject-based tables for the data required is the first step of creating a database in Microsoft Access.
Queries
In Microsoft Acess, you can use queries to apply conditions that will sort, search, and filter the data into relevant views, so specific information in the database is easier and quicker to find.
You can also use Queries to calculate, summarise and combine data, and create automations with no code.
The database query language is SQL (Structured Query Language). However, you only need to learn SQL if you wish to be an advanced Microsoft Access user.
Relationships
You use Relationships to create a connection between different tables with related fields. The result of building a Relationship between tables is one table with common fields that have their relationships with other tables defined.
Relationships are essential when creating Microsoft Access databases. They reduce redundancies and repeating data.
Forms
Forms are a fundamental Microsoft Access component as it controls how the user interacts with and operates the database. For example, people can enter, edit and display data using them.
You can also design and revise forms to reflect their purpose.
Reports
Reports are a way to format, summarise and show the results and information given by the database. Once you have created the report, Microsoft Access saves it in an uneditable format, such as a PDF.
Macros
Microsoft Access Macros allow the database to carry out actions automatically. It is essentially a simplified version of coding where, instead, you select a list of actions from a drop-down list to create the automation.
The order of actions given in your list will be the order in which the automation performs the steps and doesn’t require code in a Visual Basic for Applications (VBA) module.
Modules
Modules are where user-defined actions, functions and global variables created using VBA are written, stored and accessed in Microsoft Access.
VBA is more powerful and versatile than Macros, but it is more complex to add functionality to the database and is usually the choice of advanced Microsoft Access users.
Interested in improving your Microsoft Macros mastery by learning how to use VBA? Click here to find out more about our extremely popular VBA course.
If you want to learn more about Microsoft Acces, check out some of our Tips and Tricks here!
Your needs are at the heart of our enterprise. We look forward to hearing what your training requirements are and how we can help you or your company reach your goals every step of the way.
Automations are one of the biggest buzzwords around – we’d likely all love to automate our mundane tasks at home, but how can they help in the workplace?
So what are automations?
Automations essentially are the use of technology to replace or reduce manual human input, and they come in two main forms;
Physical devices Eg. the humble dishwasher
Digital software Eg. scheduling a repeat event in a calendar app
The latter, digital automation, has become increasingly popular in business, with the Covid-19 pandemic triggering a steep increase in the shift towards automated processes, especially by small businesses and solo business owners.
In fact, McKinsey states that:
“…recent data show that we have vaulted five years forward in consumer and business digital adoption in a matter of around eight weeks.”
(Click here if you want to read more on the digital technology uptake during Covid-19)
But why the rise in popularity?
1. Automations save time
By reducing mindless, slow, recurring processes, there’s more time to focus on tasks that can’t be automated. For example, administrative work and responding to leads; two highly time-consuming aspects of business but don’t always require human input.
By automating these responsibilities, hours of an employee’s day can be saved. There is now more time available for your team to focus on devising and implementing innovative and creative solutions that will drive your business forward.
Not only this, but automations may also improve your employee’s morale.
It goes to stand that increasing the time taken on menial tasks means more an employee can achieve in a day. This greater productivity can lead to greater work satisfaction and fulfilment.
2. Quality assurance
Automations are also helpful with quality assurance and improving consistency by minimising the potential of human error.
Depending on the individual, people can sustain concentration anywhere from 10 minutes to an hour. Therefore, for tasks like data entry or those tending towards repetitive, frequent breaks are recommended to maintain focus.
Given the already significant to-do list most of us face on an average day, breaks are a commodity, with speed generally trumping accuracy. Mistakes are inevitable.
For example, a spreadsheet can be populated almost instantly using an automation. This is quicker than someone individually inputting data and reduces the chance of avoidable phase-out-induced mistakes.
3. Cost-effective
Automations are also a cost-effective solution for scaling up small businesses.
As discussed, employees can achieve more daily by reducing the time spent on repeatable tasks. The increase in efficiency leads to greater productivity in the workplace. Therefore companies can function at a higher rate without requiring an equal uptake of new employees.
By investing in automations, small businesses can put their resources to better use and compete with companies that operate with a larger workforce.
Not ready to invest in fully automating your company?
Don’t worry. There are a few free softwares that are simple to use and don’t require any coding experience that can get you started on creating some simple automations.
In fact, our previous blog discussed one such software. Click here to find out more!
Want to stop wasting time on tedious, repetitive tasks? Maybe it’s time to try Power Automate! Read on for our guided tour and an example to get you started.
Microsoft Power Automate does what it says on the tin. It lets you automate things. It even enables you to automate almost anything without coding, making it far easier to pick up and learn. Moreover, it’s free for all windows 10 and 11 users!
It can use your favourite applications to synchronise files, collect data, send reminders and emails or anything else that tempts your imagination. It even has pre-built automation templates for standard processes that are customisable to suit your needs better.
Power Automate was previously known as Microsoft Flow, and it comes in two types:
Part of Office 365 – accessible if you have an Office subscription.
Power Automate Desktop – a desktop application that integrates with Office 365 and is accessible even if you do not have a paid Office subscription.
Paid subscription or non-paid subscription, you won’t be missing out on what Microsoft Power Automate has to offer.
Taking just a little time to learn how to automate business processes using this app will save you time, speed up work and reduce costs.
Power Automate
There are two main components for Power Automate; theConsole and the Flow Designer.
Power Automate Console
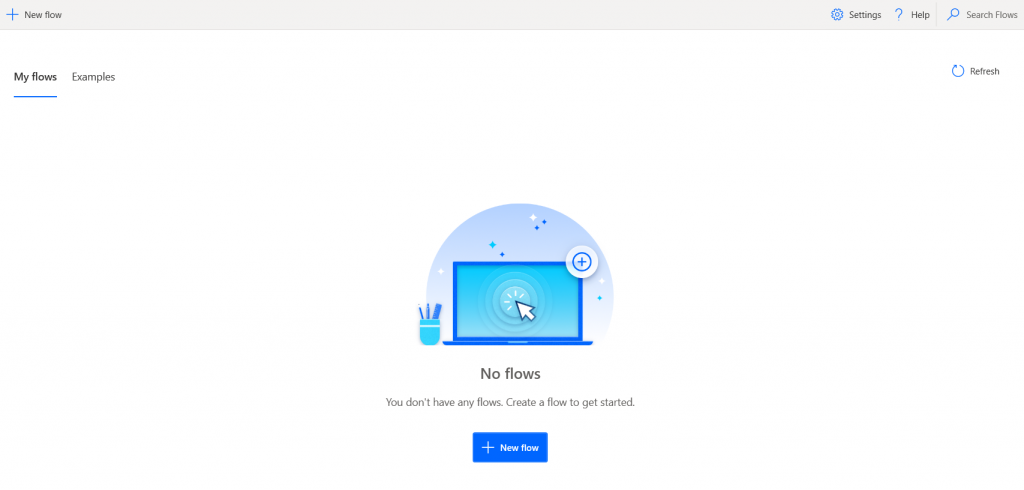
The Console is the first thing you will see when you open Microsoft Power Automate Desktop. To start with, it will be empty, but new flows will be stored and accessed here.
There are options here to change settings and to access Help and documentation, but most important are the options to manage existing flows and add a new flow.
Power Automate Console
Power Automate Flow Designer
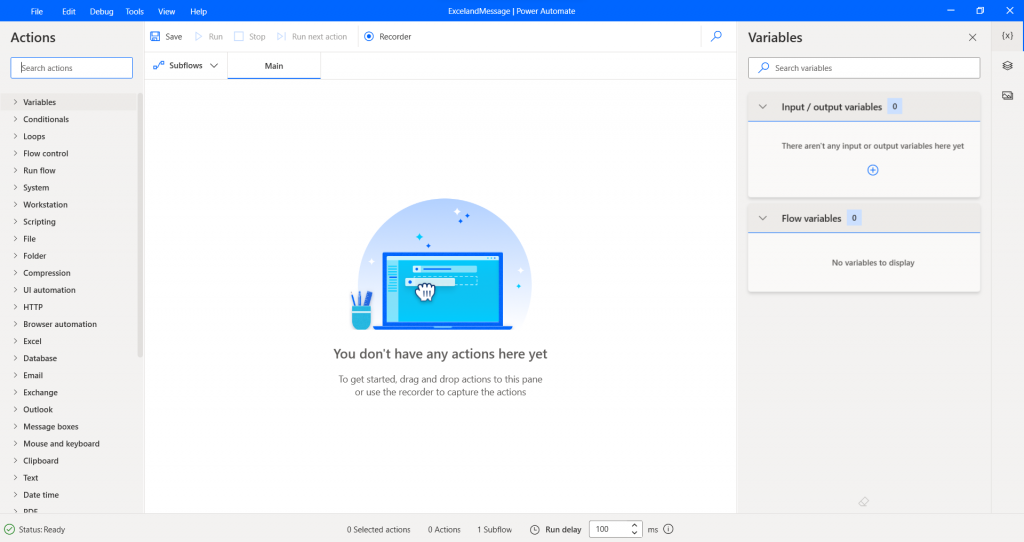
The flow designer will appear when you are creating a new flow or editing an existing flow.
You can think of flows as a series of actions that run sequentially in the order you supply. They can be programmed to make decisions using conditionals or loops that will repeat the same actions several times.
Power Automate Flow Designer
Flow Designer: Actions
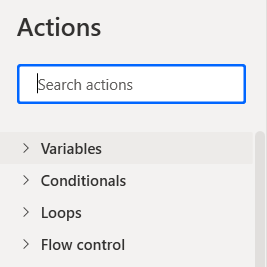
At the top left-hand corner of the Flow Designer, you will see a bar named ‘Actions’.
This area lists all the actions that Power Automate can perform, including working with files and folders, text, emails and even specific applications such as Excel.
Power Automate Actions List
Power Automate has the actions in categories, which expand by clicking the arrow next to each category, or it’s possible to search for a specific action in the search bar at the top of the action pane.
To add an action to your flow, you can either double-click it or drag and drop it onto the main working area.
Power Automate can automate highly complex sets of actions, but it is also quick and straightforward to create these automations.
For instance, we can create a flow to open Excel, display a box with a custom message and close Excel with minimal effort, as shown in the example below.
Example: Open Excel, display a box with a custom message and close Excel
1. Download and install Power Automate
The first step is downloading and installing Power Automate, which can be found here.
If you’ve somehow managed to avoid creating a Microsoft account, you may need to sign up for one before getting started. However, this is free, and you can use a preexisting email account. For example, an Outlook.com, hotmail.com, live.com, or msn.com account should work.
2. Create a New Flow in the Power Automate Console
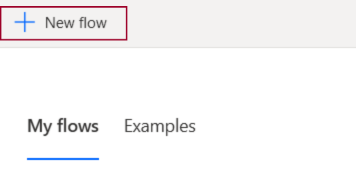
To create a new flow, simply click on the “+ New Flow” button at the top left of the screen.
Create new flow in the Automate Console
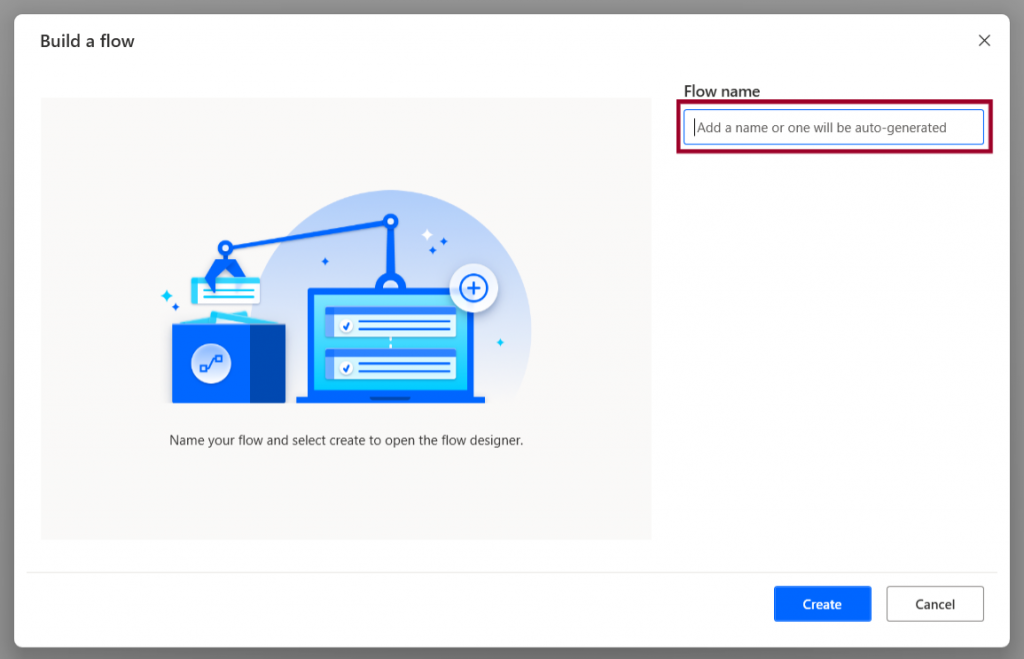
Power Automate will ask you to provide a name for the flow.
New flow naming window
Decide on a name for the new flow and click “Create“. In this case, we have named it “ExcelandMessage“.
3. Launch Excel Action
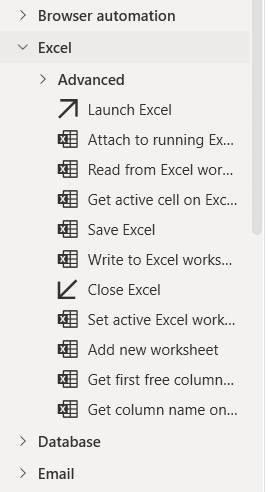
The next step is to locate the “Excel” actions in the Action list and expand the category.
Expanded Excel action in the Action list
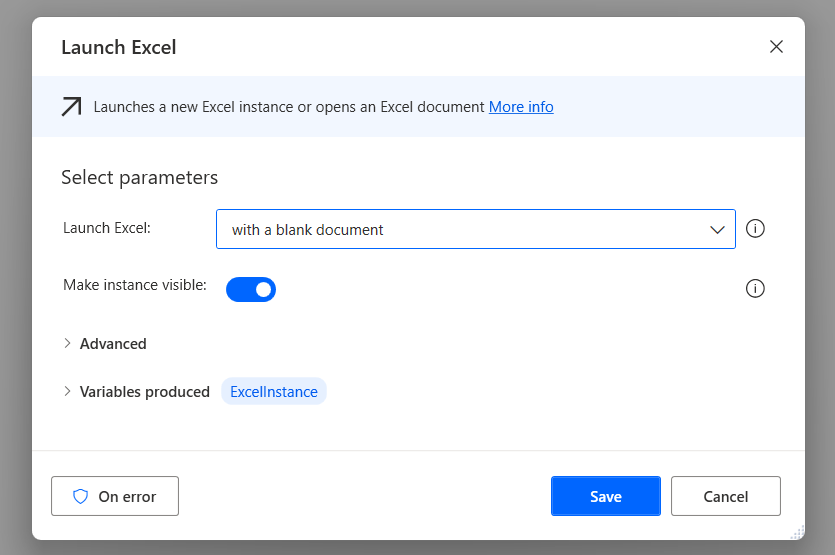
Double-clicking or dragging the “Launch Excel” action to the main working area will launch the dialogue box window with options to open a new, blank Excel document or an existing one.
Launch Excel Window
We can change other options, but we will leave everything in the default setting.
4. Create Dialogue Box After Excel Launches
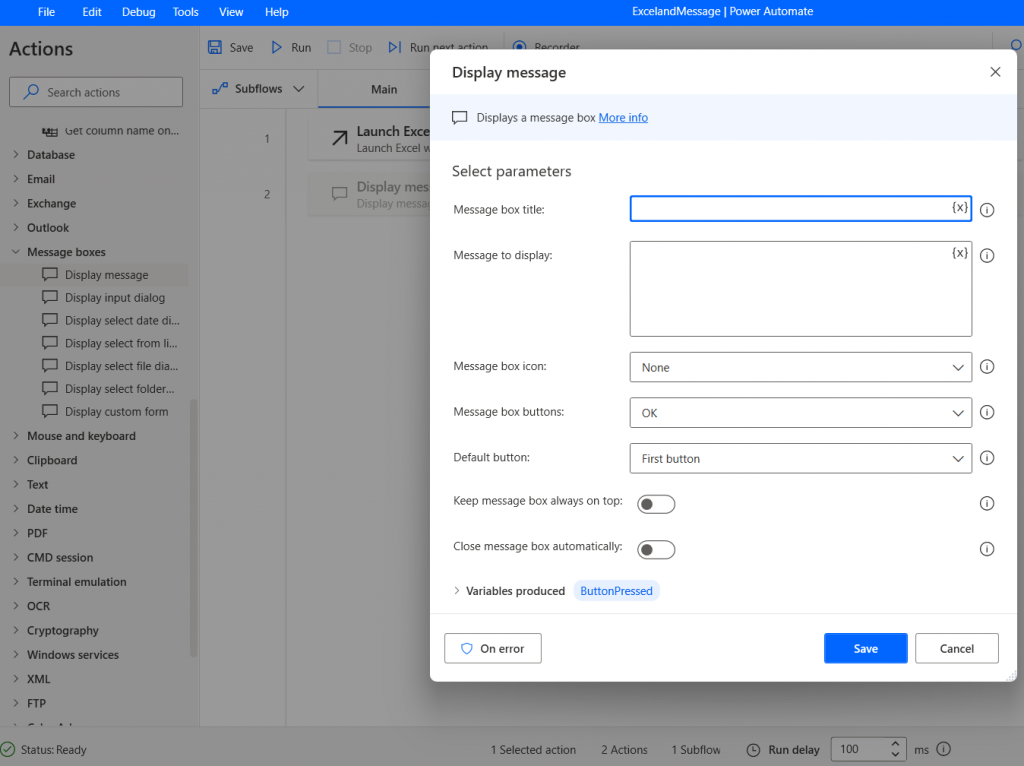
Next, we can expand the Message Boxes category in Actions and drag the ‘Display Message‘ action into the working area.
Again, a dialogue box is displayed that lets us enter the message box title and the message to display, along with other options.
Display Message window
In this case, we have set the Message box title to “Excel Message“, the message to display to “You just launched Excel with Power Automate“, and save this action
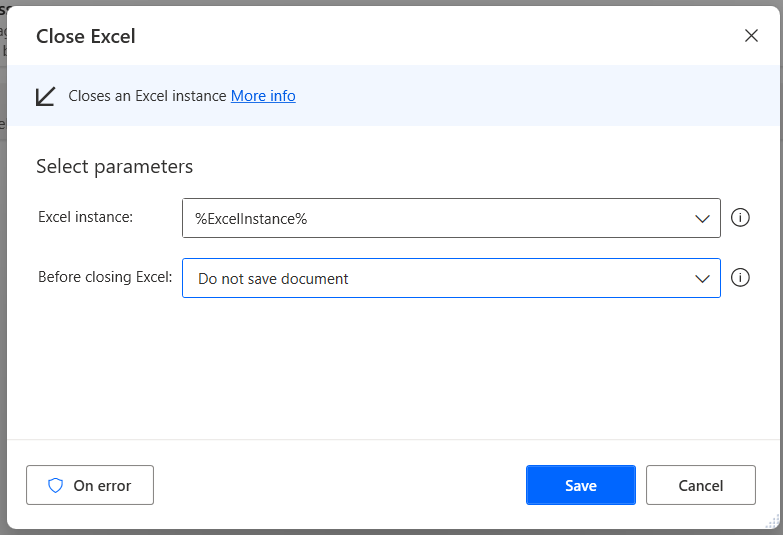
5. Close Excel Action
Similarly to launching Excel, we locate Excel actions and expand the category but this time, select the “Close Excel” action.
Close Excel Window
Again, we have the option of whether or not the document should be saved.
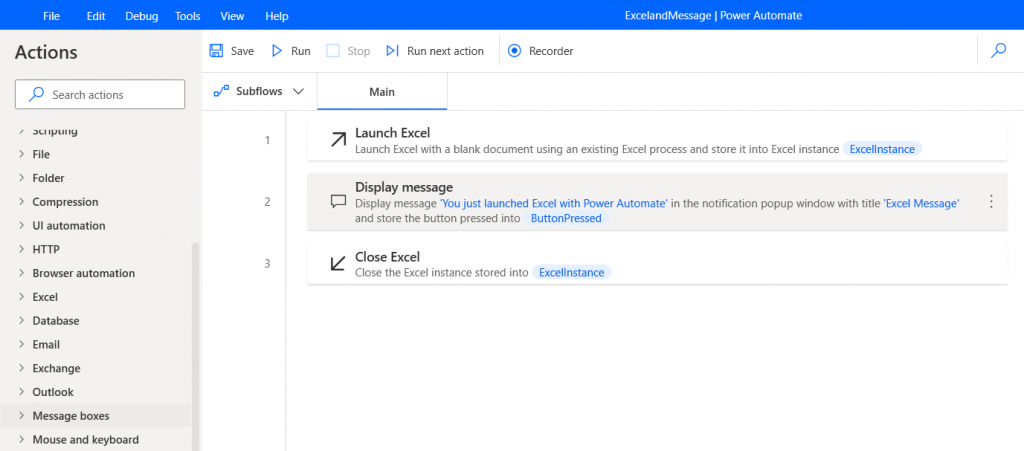
The completed flow looks like this:
Completed flow in the Flow Designer
6. Save and Run the Automation
With all this done, we can save the flow and close it to return to the Power Automate console.
Here we can see our newly created flow (it is possible to run a flow whilst still in the flow designer, at any stage, to test it).
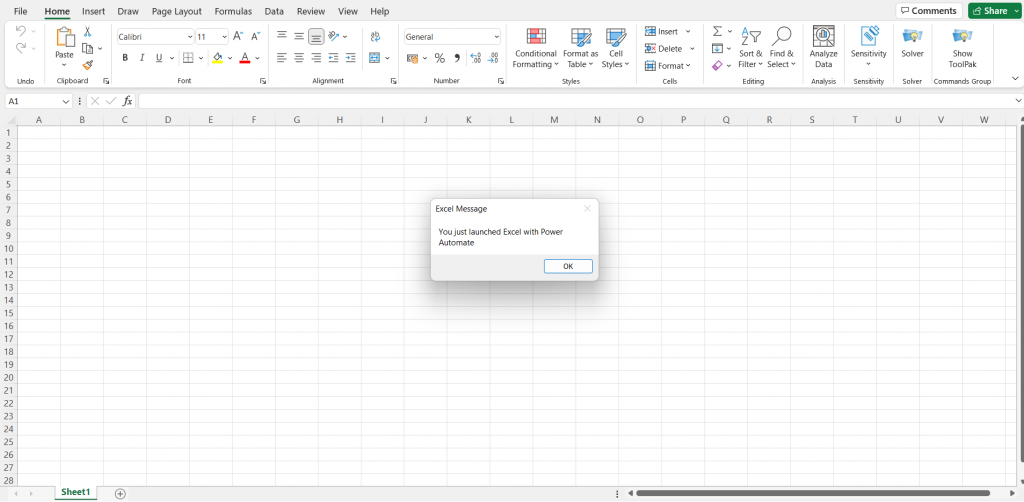
We can run the newly created flow just by clicking on the ‘play’ button. Excel opens, and the message box is displayed.
Excel launching with Excel message displayed
On pressing the ‘OK’ button, Power Automate runs the last action and closes Excel.
In addition to all the built-in actions, Power Automate allows you to record yourself performing any task in Windows and use this as a Flow or use the recording as part of a flow using built-in actions.
Microsoft has an online Learning Path to get you started with Power Automate, and you can find it here.