Archive for the 'Microsoft Office Articles' Category

Excel Tips and Tricks: How to Use the Excel Freeze Function

How frustrating is it when you scroll across a spreadsheet, and all the useful information disappears? Give your memory a break with the excel freeze function!

Excel Tips and Tricks: Freeze Function

Excel is an incredible tool for storing and managing data. However, scrolling across or down a spreadsheet is inevitable when dealing with magnitudes of cells. It would be ever so helpful to see the column and/or row titles while navigating other areas of the spreadsheet to make sense of and compare data.

BAM! In walks the Excel freeze function to save us all from repetitive strain injury.

Excel Freeze Function

So where can you find this handy tool?

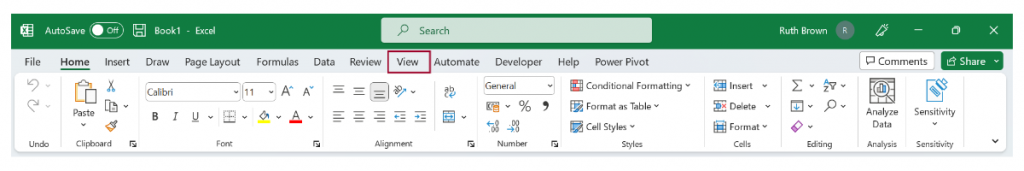
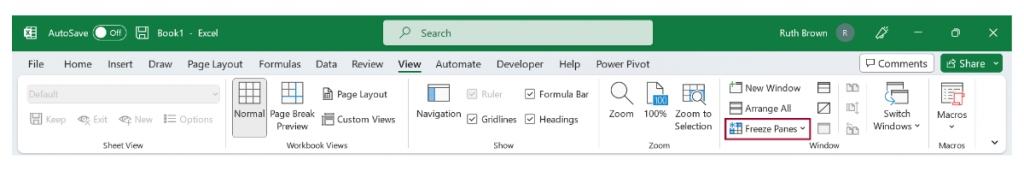
From the open spreadsheet, select the ‘View‘ tab and then the ‘Freeze Panes‘ function, which is found in the ‘Window’ group of the View tab (Select View > Freeze Panes).

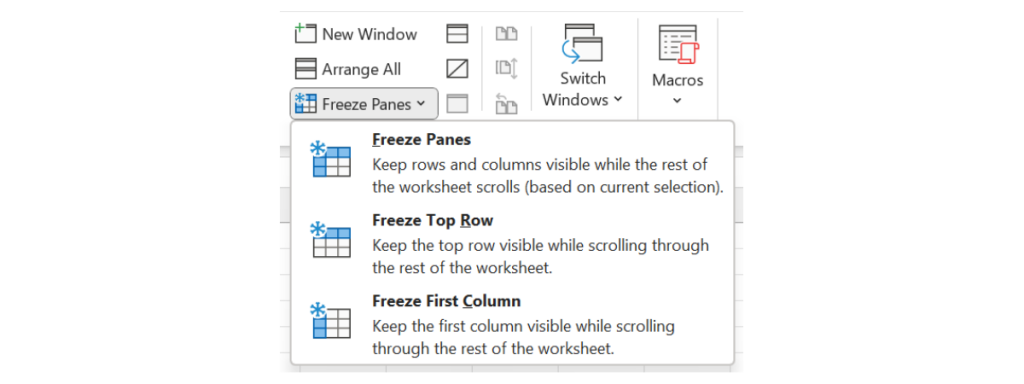
From here, you can see three options:

  1. Freeze Panes
  2. Freeze Top Row
  3. Freeze First Column
Step 1. Select View
Step 2. Select Freeze Panes
Freeze Pane Options

To get to grips with how to use the different Freeze options, check out the examples below!

1. Freeze Top Row

From freeze panes, select ‘freeze top row’.

Excel will automatically freeze the first row of the spreadsheet, which is indicated by a dark grey horizontal line beneath the first row.

2. Freeze First Column

From freeze panes, select ‘freeze first column’.

Again, Excel automatically freezes the first column of the spreadsheet, which is indicated by a dark grey vertical line to the right of the first column.

3. Freeze Panes

The above are extremely straightforward but don’t allow much flexibility. Freeze panes is slightly more complicated but gives more freedom.

For example, you can freeze multiple rows, multiple columns or multiple rows and columns. 

3.1 Freezing multiple rows

If you were looking to freeze a certain number of rows, select the row below the last row you want to remain visible and select freeze panes.

For example, if you want the first three rows to remain visible, select row four and freeze panes.

A dark grey horizontal line above row four and below row three indicates that these first three rows will remain visible whether you scroll up or down.

3.2 Freezing multiple columns

Freezing multiple columns is similar to the above example of freezing multiple rows.

Select the column to the right of the columns you want to remain visible and select freeze panes.

For example, if you want the first three columns to remain visible, select column four and freeze panes.

A dark grey vertical line to the left of column four and the right of column three indicates that these first three columns will remain visible whether you scroll left or right.

3.3 Freezing rows and columns

But what do we do when we want to freeze columns and rows?

Instead of selecting an entire row or column, we set one cell that controls which columns to the left and rows above are visible.

For example, if we want to freeze the first row and column, select the cell two rows down and two columns across (B2).

A dark grey vertical line to the left of the cell and a dark grey horizontal line above the cell indicates that the first row and column will remain visible whether we scroll across or down the spreadsheet.

4. Unfreeze Panes

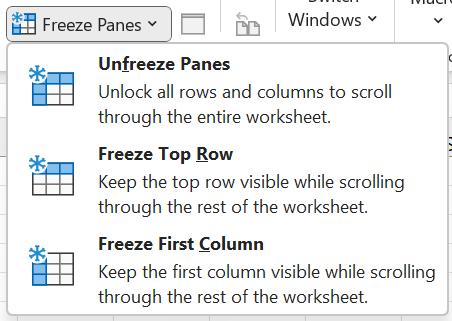
After applying one of the three Freeze Pane options, the top Freeze Pane option will be replaced with ‘Unfreeze Panes‘. Simply select this to remove all columns and rows that have been frozen.

Unfreeze Panes

Thanks for reading, and we hope this helped! For more tips and tricks, check out our other blogs here!

Want more hands-on training? Infero also offers multiple Excel courses that will take you from beginner to pro. Get in touch for more information, book a course or receive a free consultation using the details below!

Suite 2556 37 Westminister Buildings Theatre Sqaure Nottingham
NG8 2EN

Introducing Power BI and How to Get Started

Don’t let your business’s data go to waste! Power BI allows you to make data-driven decisions to achieve your company goals and propel your business forward.

Power BI

What is Power BI?

Power BI is a powerful and easy-to-use Data Visualization and Business Intelligence tool. It can take data from different, unrelated data sources and combine it into incredible interactive reports and dashboards with stunning visualisations. Moreover, the desktop version of Power BI is wholly and entirely free.

BI: (business intelligence) refers to taking raw data and transforming it to create reports that can aid in making informed business decisions. Data visualisation uses visual elements such as charts, graphs, maps, and other illustrations to analyse and find patterns and insights in data. Microsoft’s “Power BI” comprises several products and services, which include:

Microsoft Power BI Pro – A paid online service that allows users to view dashboards with a web browser and collaborate and share data. 

Power BI Mobile – A free mobile version that allows a secure connection and interaction with dashboards and reports on the go.

Microsoft Power BI Desktop – A free desktop report authoring tool that can connect to more than 70 different data sources. It’s typically known for its eye-catching visualisations, dashboards and reports. 

With Power BI Desktop, you can:

  1. Get data from a wide variety of data sources and shape the data to match your reporting needs.
  2. Create relationships between your data and change data formats
  3. Create reports choosing from dozens of visualisations with almost limitless formatting options.
  4. Save your reports as a Power BI Desktop file. 
  5. Upload or publish your reports

Where to download Power BI

Power BI Desktop is available in both 32-bit and 64-bit versions. To download the latest version, you can use the following link.

Or you can use this link to download the Power BI files directly.

After clicking the link, you can choose the language you want to download the software. There are details on system requirements and installation instructions.

Download Microsoft Power BI Desktop

Power BI – The Main Tools

1. Welcome window

When Power BI is installed and opened, it launches a welcome screen. From here, it is possible to open data sources, see any new developments in the programme and access tutorials.

Microsoft Power BI Welcome Screen

2. Power BI main interface

You will see the main Power BI Interface after closing the welcome screen. 

Microsoft Power BI Main Interface

The Power BI interface, on first look, seems slightly different to other MS Office products. Still, it has many familiar elements, such as the ribbon with tabs and groups of command buttons.

Power BI Ribbon

3. Data sources

To access all of the various options regarding data sources, select the ‘Get data’ command located in the Data group of the Home tab. The command will display a list of ‘Common data sources‘.

Power BI Common Data Sources

Clicking ‘More…‘ in this list will open a dialogue box that lists all the possible sources from which Power BI can access data.

Power BI Data Source List

Here you can connect to different flat files such as Excel Workbooks and Text files, sources such as an SQL database, and web platforms such as Facebook, Google Analytics, and Salesforce objects.

BI is about providing the right data at the right time to the right people so that they can take the right decisions.

Nic Smith with Microsoft BI Solutions Marketing

4. Power Bi Canvas

The most used area is known as the ‘Canvas‘. You can create and configure reports, data, relationships, and dashboards here.

Power BI Canvas View

By default, Canvas displays the Report View, which shows visualisations and reports, but you can change the view by selecting the View selection icons on the left side of the Power BI interface.

View Selection Panel

Choosing the ‘Data View‘ will display the data tables from your data sources.

Power BI Data View

The ‘Model View‘ will show any relationships between the different tables of Data.

Power BI Model View

5. Configuration panes

The last main area of the Power BI interface is the ‘Configuration panes‘. There are three of these on display by default, which can change depending on what you are viewing. They are the following: 

Filters pane – Add/Configure filters to govern the data shown.

Visualisations pane – Choose visualisation type

Fields pane – Shows the field’s data source. Add data to reports by dragging fields onto the canvas.

Power BI Configuration Panes

You can collapse all panes to provide more working area on the main canvas.

If you want to learn more about Power BI, Infero Training has a Data Analysis with Power BI course that covers starting with Power BI and much more. Please get in touch to find out more.

Suite 2556
37 Westminister Buildings
Theatre Sqaure
Nottingham, NG8 2EN

Access vs Excel: How To Choose The Right One For You

Data is a major part of life, but how do we manage it? Most use Excel, some use Access. Both have their similarities. So Access vs Excel, which should we choose?

Microsoft Access vs Microsoft Excel

Contents

To jump right in, both programs can store large amounts of data, run powerful queries and perform sophisticated calculations to return the desired results.

To put things extremely simply, you use Excel for data analysis and Access for data management.

Still, if we want to know which piece of software, specifically, might be helpful for our particular needs, it’s useful to look at the benefits of both programmes.

(Note: All Microsoft Office suites include Excel, but not all suites include Access.)

1. Access vs Excel: Advantages

1.1 Advantages of Excel

Excel is a spreadsheet programme and one of the most used applications in the world, with many benefits of use:

1. Easy to Learn: Excel takes relatively little time and effort to learn. Although Excel has many advanced functions that take longer to master, you can quickly pick up the fundamentals.

2. Data Visualisation Capabilities: Excel has an incredible number of options for visualising data, including PivotTables, graphs and charts, which you can customise however you wish. 

3. Formulas and Functions: Excel formulas can do almost anything, from simple numeric calculations to very complex analyses.

4. Flexibility: Although designed for Data analysis, Excel can be (and has been) used for almost any task

(Follow this link for our beginner’s guide to Excel)

1.2 Advantages of Access:

Access is a Microsoft database management system (DBMS) used for both small and large databases.

1. Relational Database: Access allows you to relate data in one table to data in different tables. Information can be stored in one table and referenced in another.

(NB: It is also possible to have a relational database model in Excel, but this involves using Excel’s more advanced functionality.)

2. Reporting Capabilities: Access has possibly the best report-generating capabilities of any of the members of the Microsoft Office suite.

3. Storage Capacity: Access is built to handle enormous amounts of data as a database system. It can also differentiate between different types of data.

4. Data Validation: Access allows you to check or validate data in your databases as you enter it by using validation rules.

To decide if Access or Excel is best for your needs, you can consider the following questions:

5. Flat versus relational data: Is your data relational? Data contained in a single table or worksheet is called flat or nonrelational data. In a relational database, you organise your information into multiple tables.

6. Local versus external data: You can use Access to connect to data from various external data sources to view, query, and edit that data without having to import it. You can also use Excel to connect to multiple data sources (including Access), but you cannot edit the source data through the Excel user interface.

7. Data integrity versus flexibility: Access requires unique identifiers within any Table, which help preserve the integrity of your data and which are used to relate records in one table to records in another. Excel lets you enter data more freely, although it is possible to control data entry using the Data Validation command.

8. Multi-user collaboration: Access lets multiple users open a single database simultaneously because it locks only the data that another user is editing. In Excel, you can share a workbook with other users, but collaboration works best when users work on data at different times, not simultaneously.

You can also ask which data analysis tools would best suit your purpose:

9. Querying: Access allows the creation of complex queries to view your data in various ways, retrieving only the rows and columns of data you want, whether the data is contained in one or many tables.

10. Modelling? Excel has what-if analysis tools that allow you to run different scenarios on your data, such as best-case and worst-case scenarios. No similar feature is available in Access.

11. Pivoting and charting? Excel provides PivotTable reporting and advanced charting features. Although Access can produce pivoted (Crosstab) reports and has some charts available, they are not as sophisticated as those in Excel.

(Follow this link for our beginner’s guide to Access)

2. Access vs Excel: When to Use Them

2.1 When to use Excel

Excel is incredibly flexible and can store data like Access, but is optimised for data analysis and calculation. Use Excel when you:

  • Only need a flat or nonrelational view of your data.
  • Run calculations and statistical analysis.
  • Want to use PivotTable reports.
  • Create charts regularly.
  • Want options to emphasise your data, like conditional formatting icons, data bars, and colour scales.

2.2 When to use Access

Very generally, Access is the best choice when you track and record data regularly, and need to export or produce reports for subsets of that data. Use Access when you:

  • Have multiple users.
  • Will be adding more tables to a data set.
  • Want to run complex queries.
  • Want the ability to produce complex reports.

3. Using Access and Excel together

Of course, it is not necessarily an either/or choice. There may be times when it makes sense to take advantage of both programs’ benefits. It does not matter which program you have used first. There are built-in tools to bring data into Access from Excel (and vice versa) by copying, importing, or exporting it.

If you use Access to store your data and Excel to analyse it, you can benefit from both of these excellent pieces of software.

If you would like to learn more about either software, we provide certified training courses tailored to you and your requirements. Get in touch with us today for a free, no-obligation consultation.

Barker Gate
Nottingham, NG1 1JU

Microsoft Access: Introducing You to the Database(ics)

Microsoft Access arguably doesn’t share the same fame as other Microsoft products. However, it still packs a punch. Read on to find out what it can do.

Microsoft Access

Data, data, data. It’s what most businesses boil down to; it holds the secrets to success, but if improperly managed, it is the cause of problems. It needs to be stored effectively and efficiently to keep this rich source of insight and strategy working in your favour.

The solution? Databases.

This leads us to today’s menu of discussion as one of the first mass-market database programs for Windows, Microsoft Access.

What is Microsoft Access:

Microsoft Acess is a data management system (DBMS) produced by Microsoft and part of the Microsoft 365 Office Suite.

It uses a graphic user interface (GUI) and software development tools. It’s suitable for people with and without coding experience and is used to store, manage and visualise large quantities of data.

Microsoft Access is an excellent database software solution for individuals and small to medium businesses. 

Applications of Microsoft Access:

  • Creating forms for data entry 
  • Importing data from other databases (such as Excel)
  • Creating reports that you can save in a PDF format for printing and sharing
  • Designing forms for data entry and viewing

Components of Microsoft Access:

Tables

The backbone of all databases is the tables, which hold the data and information. Like Excel, you can build tables of rows and columns, each with a field name and the rows representing a record.

Creating all the necessary subject-based tables for the data required is the first step of creating a database in Microsoft Access.

Queries

In Microsoft Acess, you can use queries to apply conditions that will sort, search, and filter the data into relevant views, so specific information in the database is easier and quicker to find.

You can also use Queries to calculate, summarise and combine data, and create automations with no code.

The database query language is SQL (Structured Query Language). However, you only need to learn SQL if you wish to be an advanced Microsoft Access user.

Relationships

You use Relationships to create a connection between different tables with related fields. The result of building a Relationship between tables is one table with common fields that have their relationships with other tables defined.

Relationships are essential when creating Microsoft Access databases. They reduce redundancies and repeating data.

Forms

Forms are a fundamental Microsoft Access component as it controls how the user interacts with and operates the database. For example, people can enter, edit and display data using them.

You can also design and revise forms to reflect their purpose.

Reports

Reports are a way to format, summarise and show the results and information given by the database. Once you have created the report, Microsoft Access saves it in an uneditable format, such as a PDF.

Macros

Microsoft Access Macros allow the database to carry out actions automatically. It is essentially a simplified version of coding where, instead, you select a list of actions from a drop-down list to create the automation.

The order of actions given in your list will be the order in which the automation performs the steps and doesn’t require code in a Visual Basic for Applications (VBA) module.

Modules

Modules are where user-defined actions, functions and global variables created using VBA are written, stored and accessed in Microsoft Access.

VBA is more powerful and versatile than Macros, but it is more complex to add functionality to the database and is usually the choice of advanced Microsoft Access users.

Interested in improving your Microsoft Macros mastery by learning how to use VBA? Click here to find out more about our extremely popular VBA course.

If you want to learn more about Microsoft Acces, check out some of our Tips and Tricks here!

Your needs are at the heart of our enterprise. We look forward to hearing what your training requirements are and how we can help you or your company reach your goals every step of the way.

Microsoft Power Automate: How to Get Down With the Flow

Want to stop wasting time on tedious, repetitive tasks? Maybe it’s time to try Power Automate! Read on for our guided tour and an example to get you started.

Microsoft Power Automate does what it says on the tin. It lets you automate things. It even enables you to automate almost anything without coding, making it far easier to pick up and learn. Moreover, it’s free for all windows 10 and 11 users!

It can use your favourite applications to synchronise files, collect data, send reminders and emails or anything else that tempts your imagination. It even has pre-built automation templates for standard processes that are customisable to suit your needs better.

Power Automate was previously known as Microsoft Flow, and it comes in two types:

  1. Part of Office 365 – accessible if you have an Office subscription.
  2. Power Automate Desktop – a desktop application that integrates with Office 365 and is accessible even if you do not have a paid Office subscription.

Paid subscription or non-paid subscription, you won’t be missing out on what Microsoft Power Automate has to offer.

Taking just a little time to learn how to automate business processes using this app will save you time, speed up work and reduce costs.

Power Automate

There are two main components for Power Automate; the Console and the Flow Designer

Power Automate Console

The Console is the first thing you will see when you open Microsoft Power Automate Desktop. To start with, it will be empty, but new flows will be stored and accessed here.

There are options here to change settings and to access Help and documentation, but most important are the options to manage existing flows and add a new flow.

Power Automate Console

Power Automate Flow Designer

The flow designer will appear when you are creating a new flow or editing an existing flow.

You can think of flows as a series of actions that run sequentially in the order you supply. They can be programmed to make decisions using conditionals or loops that will repeat the same actions several times.

Power Automate Flow Designer

Flow Designer: Actions

At the top left-hand corner of the Flow Designer, you will see a bar named ‘Actions’.

This area lists all the actions that Power Automate can perform, including working with files and folders, text, emails and even specific applications such as Excel.

Power Automate Actions List

Power Automate has the actions in categories, which expand by clicking the arrow next to each category, or it’s possible to search for a specific action in the search bar at the top of the action pane.

To add an action to your flow, you can either double-click it or drag and drop it onto the main working area.

Power Automate can automate highly complex sets of actions, but it is also quick and straightforward to create these automations.

For instance, we can create a flow to open Excel, display a box with a custom message and close Excel with minimal effort, as shown in the example below.

Example: Open Excel, display a box with a custom message and close Excel

1. Download and install Power Automate

The first step is downloading and installing Power Automate, which can be found here.

If you’ve somehow managed to avoid creating a Microsoft account, you may need to sign up for one before getting started. However, this is free, and you can use a preexisting email account. For example, an Outlook.com, hotmail.com, live.com, or msn.com account should work.

2. Create a New Flow in the Power Automate Console

To create a new flow, simply click on the “+ New Flow” button at the top left of the screen.

Create new flow in the Automate Console

Power Automate will ask you to provide a name for the flow.

New flow naming window

Decide on a name for the new flow and click “Create“. In this case, we have named it “ExcelandMessage“.

3. Launch Excel Action

The next step is to locate the “Excel” actions in the Action list and expand the category.

Expanded Excel action in the Action list

Double-clicking or dragging the “Launch Excel” action to the main working area will launch the dialogue box window with options to open a new, blank Excel document or an existing one.

Launch Excel Window

We can change other options, but we will leave everything in the default setting.

4. Create Dialogue Box After Excel Launches

Next, we can expand the Message Boxes category in Actions and drag the ‘Display Message‘ action into the working area.

Again, a dialogue box is displayed that lets us enter the message box title and the message to display, along with other options.

Display Message window

In this case, we have set the Message box title to “Excel Message“, the message to display to “You just launched Excel with Power Automate“, and save this action

5. Close Excel Action

Similarly to launching Excel, we locate Excel actions and expand the category but this time, select the “Close Excel” action.

Close Excel Window

Again, we have the option of whether or not the document should be saved.

The completed flow looks like this:

Completed flow in the Flow Designer

6. Save and Run the Automation

With all this done, we can save the flow and close it to return to the Power Automate console.

Here we can see our newly created flow (it is possible to run a flow whilst still in the flow designer, at any stage, to test it).

We can run the newly created flow just by clicking on the ‘play’ button. Excel opens, and the message box is displayed.

Excel launching with Excel message displayed

On pressing the ‘OK’ button, Power Automate runs the last action and closes Excel.

In addition to all the built-in actions, Power Automate allows you to record yourself performing any task in Windows and use this as a Flow or use the recording as part of a flow using built-in actions.

Microsoft has an online Learning Path to get you started with Power Automate, and you can find it here.

Why You SHOULD Learn New Skills In Excel

Now might be the time to get the new job you’ve always wanted. The Office of National Statistics reported in January that “The number of job vacancies in October to December 2021 rose to a new record of 1,247,000”. In some areas, however, things are still very competitive and it takes that little bit extra to stand out. 

One skill employers always look for proficiency in is MS Excel, because the software is extremely versatile and able to be turned to almost any task. It is also very widely used, in all types of industries including HR, Marketing, Retail and more. This is due to the depth of functionality that Excel has, being able to do everything from calculating, to sorting, organising and evaluating data, to providing business insights through easy to understand charts and visualisations. It is the default tool in almost every organisation, used by everyone from entry-level employees to senior staff.  

Whether you’re an employee trying to stand out from the crowd or an employer trying to raise productivity in your workplace, here are our top 5 reasons Excel should be your next step in education: 

Improving efficiency in the workplace 

Since Excel allows you to manipulate large amounts of data and even automate any data processing that takes place, it is easy to save hours of repetitive work. Tasks that take hours or days can be accomplished in minutes if you know how to access the correct tool in Excel. The greater your knowledge the more work that can be done speedily and efficiently, simply by accessing the sophisticated tools that Excel puts at your disposal. 

Knowledge of Excel will also help you stand out to prospective employers, or, perhaps, increase the appreciation that your present employer has for you, and give you a helping hand towards that promotion you are after. 

Takes the strain off the IT support 

In some organisations, where the workforce does not have a good knowledge of Excel, IT support may be required to help with ordinary, day to day work-tasks. This means that the individual may be unproductive whilst waiting for help from IT and the support staff’s time is taken up in solving an issue that wouldn’t even arise if the staff member had had some elementary training. Two staff members time are wasted on something trivial and very easily solvable. For both employees and employers, just a small amount of the right training is invaluable. 

Can Save the Company Money 

It might be that the company will at some point require someone with strong Excel skills. We live in an increasing data driven society, after all. At this point it would be far more cost effective for the employer to invest in their current staff. These are the people who have knowledge of, and commitment to, the company and could use that knowledge to uncover some money-making insights, if they only had the skills. Hiring someone already proficient in Excel will be time-consuming and costly. And it will take that person literally years to gain the knowledge and understanding of the business that current employees already have. Training is an investment of a few days that provides an excellent return in terms of workflow and productivity.  

Creates Higher Satisfaction for Employees 

Performing tasks in Excel without the proper training can mean that employees have a much higher workload than they really should, because they are not able to access the functionality contained in the programme. This, in turn, can lead to a team feeling unmotivated, with lower job satisfaction, even pressured and stressed because they may feel that they aren’t fully equipped for the task. Providing advanced Excel training for your team will increase both their motivation and productivity and your turnover. And, because they are being trained and valued, employee retention will be high.

Making Yourself Necessary 

The more efficient you become as a worker and the more time you save on the normal, everyday tasks, the more you will graduate to higher levels. Continuing your training to Excel advanced level can make you almost irreplaceable. Developing new skills helps you stay on top of your game and is a win-win for both the employee and the employer. 

If you’re looking for training for yourself or your employees, we offer Excel courses at three levels, catered for your pre-existing knowledge and experience.  

How To Identify Version Of Microsoft Office

When buying a course or looking for tips, it’s easier for the provider if you know which version of Microsoft Office you’re using. This guide will show you how to identify this on either Windows or Mac.


When using Windows


  1. Open any of your Office applications (Word or Excel) and create a new document.
  2. Choose File in the top left corner, and then select either Account or Help from the list on the left.
  3. Under Product Information, you’ll see your Office product name and, in some cases, the full version number.
  4. If the full version number doesn’t appear here, choose About Excel. A dialog box opens, showing the full version number and bit version (32- or 64-bit) at the top.

excel product


1 – Product name, such as Microsoft Office Professional Plus 2013 or Office Home and Student 2016

2 – Full version number, which starts with 15 for Office 2013 or 16 for Office 2016.


On Mac


  1. Open any of your Office applications (E.g. Word or Excel) and create a new document.
  2. Go to the Excel menu and choose About Excel.
  3. In the dialog box that opens, the version number appears in the middle (Office for Mac 2016) or in the top left (Office for Mac 2011).


excel


If you have any questions or need any help at all message us on Facebook and Twitter


Microsoft Word Tip: Creating a Header

If you want to create a poster or letter document in Microsoft word, then it could be useful to use the Header option, to give your document a professional look. The header feature allows the user to add smart looking areas in the top, bottom and side margins of a document.


Why is using a header or footer useful? well many online forums would suggest that when sending a document with a header, employers see a strong level of professionalism and that it shows that you have a good knowledge of using Microsoft word.


To use this feature, simply click the Insert Tab, and then in the Header and Footer group, Select either a header of footer.


Picture1


From the Drop Down Menu below the Header option, Select which Design you would like.


Design Drop Down Menu


Once you have selected the Design Template then you can Customise it to how you like. To customise the header,  select the Edit Header option shown at the bottom of the picture above. The customise steps are simple and easy to follow and it will give you the freedom to design exactly how you would like the header to look.


See our other Microsoft Word Hints and Tips.


Don’t forget to follow us on Twitter and Facebook.

Microsoft Word Tips : Table of Contents

TImagine you’re working with a really long document in Microsoft Word, like an academic paper or a big report. Depending on the project, it might be dozens or even hundreds of pages long! When a document is this large, it can be difficult to remember which page has what information. Fortunately, Word allows you to insert a table of contents, making it easy to organize and navigate your document.

A table of contents is just like the list of chapters at the beginning of a book. It lists each section in the document and the page number where that section begins.

You could create a table of contents manually—typing the section names and page numbers—but it would take a lot of work. And if you ever decide to rearrange your sections or add more information, you’ll have to update everything all over again. However, with the right formatting, Word can create and update a table of contents automatically.

We’ll use Word 2013 to show you how to create a table of contents, but you can use the exact same method in Word 2010 or Word 2007.

Introducing Sway!

462ae32184d166b666d3270546db7e8fe1744baa


In August 2015, Microsoft released a brand new software called, Sway – an online package to create and share your amazing stories, presentations and more!


It is a part of the Microsoft Office Online package; similar to Excel, PowerPoint, and Word Online. Sway can be used to create presentation style websites which are great for for telling stories or documenting an event. So how about having a go and documenting your fantastic Christmas and making it a one that no one will forget.


In a nutshell, Sway is an updated version of PowerPoint that is more user friendly. At a glance its easy to follow and if you wish to import media into your project then you don’t even need to leave the app.


Sway is currently available on Windows 10 and IOS, However it must be a downloaded app. alternatively it can be accessed through Office Online.


With Christmas just around the corner most families like to document the celebrations by videoing the special occasion, but using Sway takes it to another level. You can upload videos, pictures, and add text to a family friendly user face and share it directly to social media like Facebook and Twitter.


So check it out, and show us your results!