The Task Inspect Tool was introduced by Microsoft in Project 2010 to help project managers have even more control on their project and help, especially in long and complicated projects, and to determine and track down the causes of slipping tasks, which can be very problematic. Trying to determine which predecessor relationship is pushing the scheduled start date out can be difficult with linked tasks residing multiple screens away.
After you have added your tasks, assigned resources and set your predecessors, you can use the Task Inspect too to help manage the project easily, without the need to bring up the Task Information Dialogue box every time.
To get the Task Inspect Tool:
1) Go to Task Tab on the Ribbon and head to the Tasks Command Group
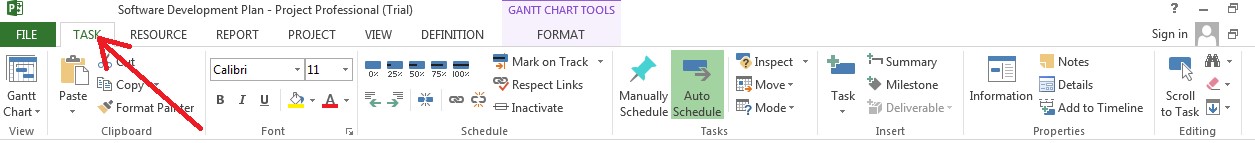
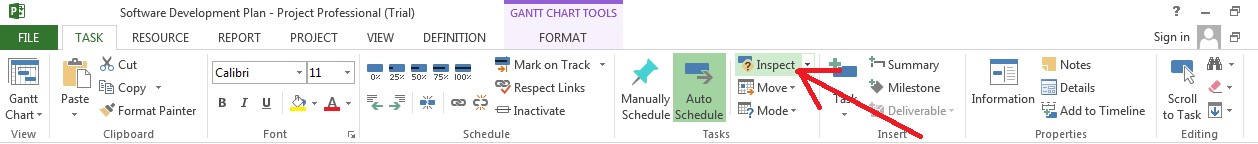
2) Click on the Inspect command
3) This will bring the Task Inspect Tool next to the Ghant Chart Table view in Project. Now every time you select a Task the Task Inspector will bring all the details (predecessors, Assigned Resources, Calendars…) up in a simpler view.
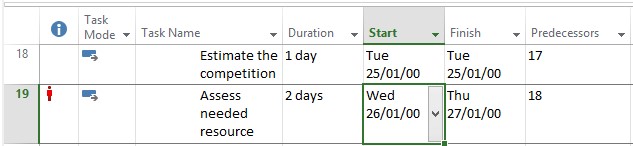
As you can see from screen grab, the Task Inspector can also be useful if Resourced assigned to the tasks are over allocated and will give you possible solutions.
If you want to learn more about Microsoft Project, join our Microsoft Project course. You can also sign up to mailing list for more hints & tips on Project and other MS applications.


